Brand Experience
What Is A Good NPS Score? The Breakdown, Calculation & Best Practices
Article written by Kate Williams
Product Marketing Manager at SurveySparrow
17 min read
30 May 2024


Brand Experience
Article written by Kate Williams
Product Marketing Manager at SurveySparrow
17 min read
30 May 2024
Ever wonder, “What is a good NPS score, and why does it matter?” You’re not alone.
In the digital age, where customer opinions are as loud as billboards, understanding and leveraging your Net Promoter Score (NPS) can be your secret weapon to winning the market. It’s not just a metric; it’s a crystal ball revealing what your customers truly think about your brand.
In this no-fluff guide, we’re diving deep into the world of NPS. You’ll learn how to calculate it, interpret it like a pro, and use it to catapult your business to new heights. We’ll decode the mystery behind what makes a great NPS score and how you can achieve it. Plus, prepare for some insider tips and best practices that even the big players in your industry might not be using yet.
First, it’s crucial to understand the overall concept of NPS and its structure.
The Net Promoter Score (NPS) is a widely used market research metric that gauges customer loyalty and satisfaction with a company’s product or service. It’s based on a single survey question that asks respondents to rate the likelihood of recommending the company, product, or service to friends, family, or colleagues on a scale from 0 to 10.
Why NPS Matters: Your NPS score is more than a number; it’s the pulse of your customer satisfaction. A high NPS means customers love your service or product enough to recommend it to others, a sign of true customer loyalty and a predictor of business growth.
NPS revolves around measuring customer loyalty and brand advocacy, meaning understanding what the customers think about your brand and how highly they rate it. It’s one of the most straightforward metrics requiring a simple question to gauge customer loyalty. That simple question is generally,
“On a scale of 0-10, what’s your likelihood of recommending our product/service to your family and friends?”
The customers give their responses to the question upon which they’re categorized into three groups;
You know the overall concept and structure of NPS now. So, what is a good NPS score? You ask again. We share your sentiment, but is it worth your time to know a good NPS score without knowing how to calculate it?
Sure, you can use SurveySparrow’s NPS calculator, but being the curious personas we are, we’ll be interested to know the math behind this simple yet effective metric. That’s why let us quickly answer the question on calculating net promoter score, and we’ll get to the good part then (literally!).
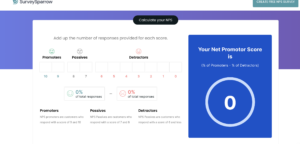
Ok, let’s take a step-by-step process here:
For example, 150 customers responded to your survey, of which 70, 30, and 50 are the promoter, detractors, and passives split.
So, the percentage of promoters is 46.6%, and of detractors is 20%.
Therefore, the NPS is 46.6% – 20% = 26.6%
Voila! Here you go! Your overall NPS is 26 in a range of -100 to 100. And it cannot be 26.6, as NPS is always displayed in whole numbers. It’s a cinch stuff that way.

A personalized walkthrough by our experts. No strings attached!
A “good” Net Promoter Score (NPS) can vary significantly depending on the industry and market context. However, as a general rule of thumb, an NPS can be interpreted as follows:
It’s important to understand that these benchmarks are not absolute. What constitutes a good NPS score can differ greatly between industries. For example, a score considered excellent in one sector might be just average in another. For instance, industries like luxury goods or high-end services might naturally have higher NPS benchmarks. In contrast, sectors with traditionally lower customer satisfaction rates, like telecommunications or utilities, might have lower average scores.
Determining what constitutes a “good” Net Promoter Score (NPS) for a company largely depends on the industry context and market standards. While there’s no universal benchmark, here’s a general guideline to help you interpret NPS scores:
Remember, these are broad guidelines. The interpretation of a good NPS can vary between industries. To accurately assess whether your NPS is good, it’s best to compare it with industry-specific benchmarks.
| Industry | Average NPS Benchmark (2024) |
|---|---|
| Hospital & Health Care | 58 |
| Computer Products & Network Security | 34 |
| Marketing & Advertising | 44 |
| Accounting | 72 |
| Apparel & Fashion | 72 |
| Broadcast Media | 15 |
| Building Materials | 81 |
| Education | 66 |
| Real Estate | 30 |
| Luxury Goods and Jewellery | 45 |
| Technology Companies | Not specified |
| Financial Institutions | Not specified |
Please note that these benchmarks are specific to 2024 and can vary from year to year. Also, the scores for some industries like Technology Companies and Financial Institutions, are not explicitly mentioned, but these sectors have shown trends of high customer satisfaction and loyalty.
The Absolute and Relative NPS methods are the two ways to determine whether an NPS score is good. One uses the aforementioned industry benchmarking, and the other doesn’t. And it’s really up to you to choose the method you wanna go with.
Let’s understand a bit more about the two before you make a decision here;
Using this method, if your score dips below 0, i.e., a negative NPS, you have more detractors. In that case, most of your existing customers won’t prefer recommending your brand.
This method considers the absolute numbers, making the negative NPS scores a sign of more detractors and a score of 50+ is a sign of more promoters—anything in between means that you have a majority of passive customers.
Using the Relative NPS outlook, comparing your brand’s NPS score with relevant industry benchmarks becomes the key to deciding if the NPS score is good compared to competitors. Simple and straight, what say?
Employee Net Promoter Score (eNPS) is a metric to gauge employees’ willingness to recommend their workplace to friends or acquaintances. Like the Net Promoter Score (NPS) used for customers, eNPS helps measure employee satisfaction and loyalty.
The scoring for eNPS typically follows the same 0-10 scale, with respondents categorized as Promoters (9-10), Passives (7-8), and Detractors (0-6). The NPS is calculated by subtracting the percentage of Detractors from the percentage of Promoters.
Understanding what constitutes a “good” eNPS score is less straightforward than customer NPS, as it can vary significantly across industries, regions, and company sizes. However, here’s a general guideline:
After having covered the major and the interesting topics, this is what remains: How do you make and analyze an NPS survey using SurveySparrow?
Why SurveySparrow? Well, it offers the most robust and powerful NPS feedback software to collect ratings from your customers and calculate NPS proactively. Read this success story to know how exactly it can help your company.
Get everything about NPS resolved at SurveySprrow. Know more

Step 1: Click + New Survey on the top right corner of your survey dashboard and select NPS Survey.
Step 2: Modify the survey title and click Next.
Step 3: You can edit your NPS question to add variables like contact details or custom variables. Add the dollar sign($) next to your question.
Step 4: You can customize the label texts and enable segmenting your scale to mark promoters, passives, and detractors. The colors are customizable, too.
Step-5: For the open-ended follow-up question, edit as required and use question piping to pipe the respondents’ NPS scores into the question.
Step 6: Enable the ‘Question Text by Rating’ option to send individual follow-up questions to Promoters, Passives, and Detractors.
Step 7: Click +Add New to add more follow-up questions to your survey. Pick from the Multiple Choice, Rating, and Text question types.
Step 8: Add a Thank You page to your survey and personalize it using custom variables if you’d like. That’s it! You have now successfully created your NPS survey!
Step 9: Share it with your customers, and once all the responses are populated, head to the Results section and select the Overview tab. You’ll see the NPS score at the top.
After getting all the scores, here’s how you can analyze them using different options using SurveySparrow’s NPS solution;
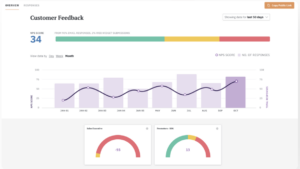
Step-1: Under Overview in the Results section, you’ll see a trend of NPS responses over time. Adjust this trend to show daily, weekly, monthly, quarterly, or year-long responses.
Step-2: Widgets help you dissect your data better and gain deeper insights into the business. Select any of the widgets by merely clicking on the box or the Add Widgets button. Read this to know more about it. And for the time being, here are the widgets we have;
Get access to pre-made NPS survey templates for free.
Now, you know how to create and analyze NPS surveys fast and efficiently, but are there some best practices to follow, too? The answer is yes, and here’s what we have in the bag for you;
Before we wrap up this ‘What is a good NPS score’ article, here are the common yet crucial NPS FAQs you should know the answers to
Very. The Net Promoter Score was developed after testing various questions to find the best alignment with customer loyalty. Fred Reichheld and Bain & Company further developed and eventually trademarked it. And many argue that it is by far the best customer loyalty metric in the market and the most accurate one, too.
No, if you want to understand your brand’s customer loyalty, sending an NPS survey every quarter or every six months works best. However, an NPS survey after every purchase will work if you want to know their loyalty towards a specific product.
Generally, NPS is meant to gauge customers’ loyalty to your brand. Hence, sending it out after every purchase would be an overkill without giving grand results. Stick to a definitive timeline of 3,6, or 12 months for these surveys to work best.
No – Rather, NPS is the difference between two percentages (percentage of Promoters less percentage of Detractor). It generates a score between -100 and +100, based on the size of your promoters and detractors compared to the overall survey takers, but it’s not a percentage.
Well, that’s debatable. But from our experience of having conducted hundreds of NPS surveys, we would say yes. It is easier to convert a Passive to a promoter compared to a Detractor. Because passive customers aren’t dissatisfied with your brand like the Detractors are, they will come along to be your brand’s Promoters if you start engaging with them the right way.
However, the risk of never hearing from a Passive customer is also real, which makes people state that Detractors are easier to convert than Passive customers because they stick with your brand and give you a second chance.
As we mentioned, the answer to ‘what a good NPS score is depends on your company’s industry. So, an NPS score of 70 is outstanding if yours is a real-estate entity and alarmingly low if you’re in the hospitality business. The industry benchmarks bring more meaning to your NPS scores, and rightly so.
Employee Net Promoter Score (eNPS) is a metric used to gauge employees’ willingness to recommend their workplace to friends or acquaintances. Similar to the Net Promoter Score (NPS) used for customers, eNPS helps measure employee satisfaction and loyalty.
The scoring for eNPS typically follows the same 0-10 scale, with respondents categorized as Promoters (9-10), Passives (7-8), and Detractors (0-6). The eNPS is calculated by subtracting the percentage of Detractors from the percentage of Promoters.
Understanding what constitutes a “good” eNPS score is less straightforward than with customer NPS, as it can significantly vary across industries, regions, and company sizes. However, here’s a general guideline:
Isn’t Jeff completely right here? Customers do tell each other about their fantastic experiences with a brand. And an NPS survey is how to know about that. Organizations, however, score very low NPS. Why? Well, because they don’t even bother conducting timely customer loyalty checks. Like our ambitious female entrepreneurs from the intro, they’re busy thinking about sales and profits.
It’s crucial, we get it, but so is your brand’s identity that a customer can relate it. Otherwise, a transactional customer relationship won’t give your business the wings of sustained growth. An NPS survey isn’t the solution to all your customer loyalty problems. It’s a way of getting to the solution, especially in this much-changed post-pandemic world.
Here’s hoping you make full use of this metric. For any help, literally any assistance, we’re here for you. Keep growing!

Thousands of brands trust SurveySparrow to turn feedback into growth. Try it free today!

Best Of
16 MINUTES
16 May 2022

Best Of
13 MINUTES
25 April 2021

Best Of
16 MINUTES
3 May 2021

Best Of
11 MINUTES
30 July 2021
14-day free trial • Cancel Anytime • No Credit Card Required • No Strings Attached
14-day free trial • Cancel Anytime • No Credit Card Required • No Strings Attached