Best Of
What Is NPS Data And How To Look At It ?
Article written by Kate Williams
Product Marketing Manager at SurveySparrow
12 min read
19 July 2024


Best Of
Article written by Kate Williams
Product Marketing Manager at SurveySparrow
12 min read
19 July 2024
In this day and age of disruptive e-commerce models, it is always word-of-mouth marketing that majorly drives consumer engagement and sales.
One of the best ways to understand the impact of consumer experience on brand growth is to analyze the Net Promoter Score (NPS). In layman terms, NPS is ‘the consumer’s likelihood to recommend and promote your brand to others based on their experience’. It is one of the most compelling metrics that define the customer’s loyalty towards your brand. If you are wondering how to look at NPS data to gauge and improve your brand growth, you’re exactly at the right place. Let’s find out right now.
Net Promoter Score (NPS), developed by Frederick F. Reichheld, is a performance metric that measures the customer’s overall satisfaction with a company’s product/service and the willingness to recommend it to others. It is the most adaptable, powerful, yet highly underrated metric since NPS is all about the customer.
NPS is omnipresent in many industries and functional areas such as marketing, customer service, and customer experience management. As simple as NPS may sound, it is actually the context in which we use the metric and the type of product/service we consider that matters more. Net Promoter Score questions, combined with several other metrics and scores, measures customer service levels.
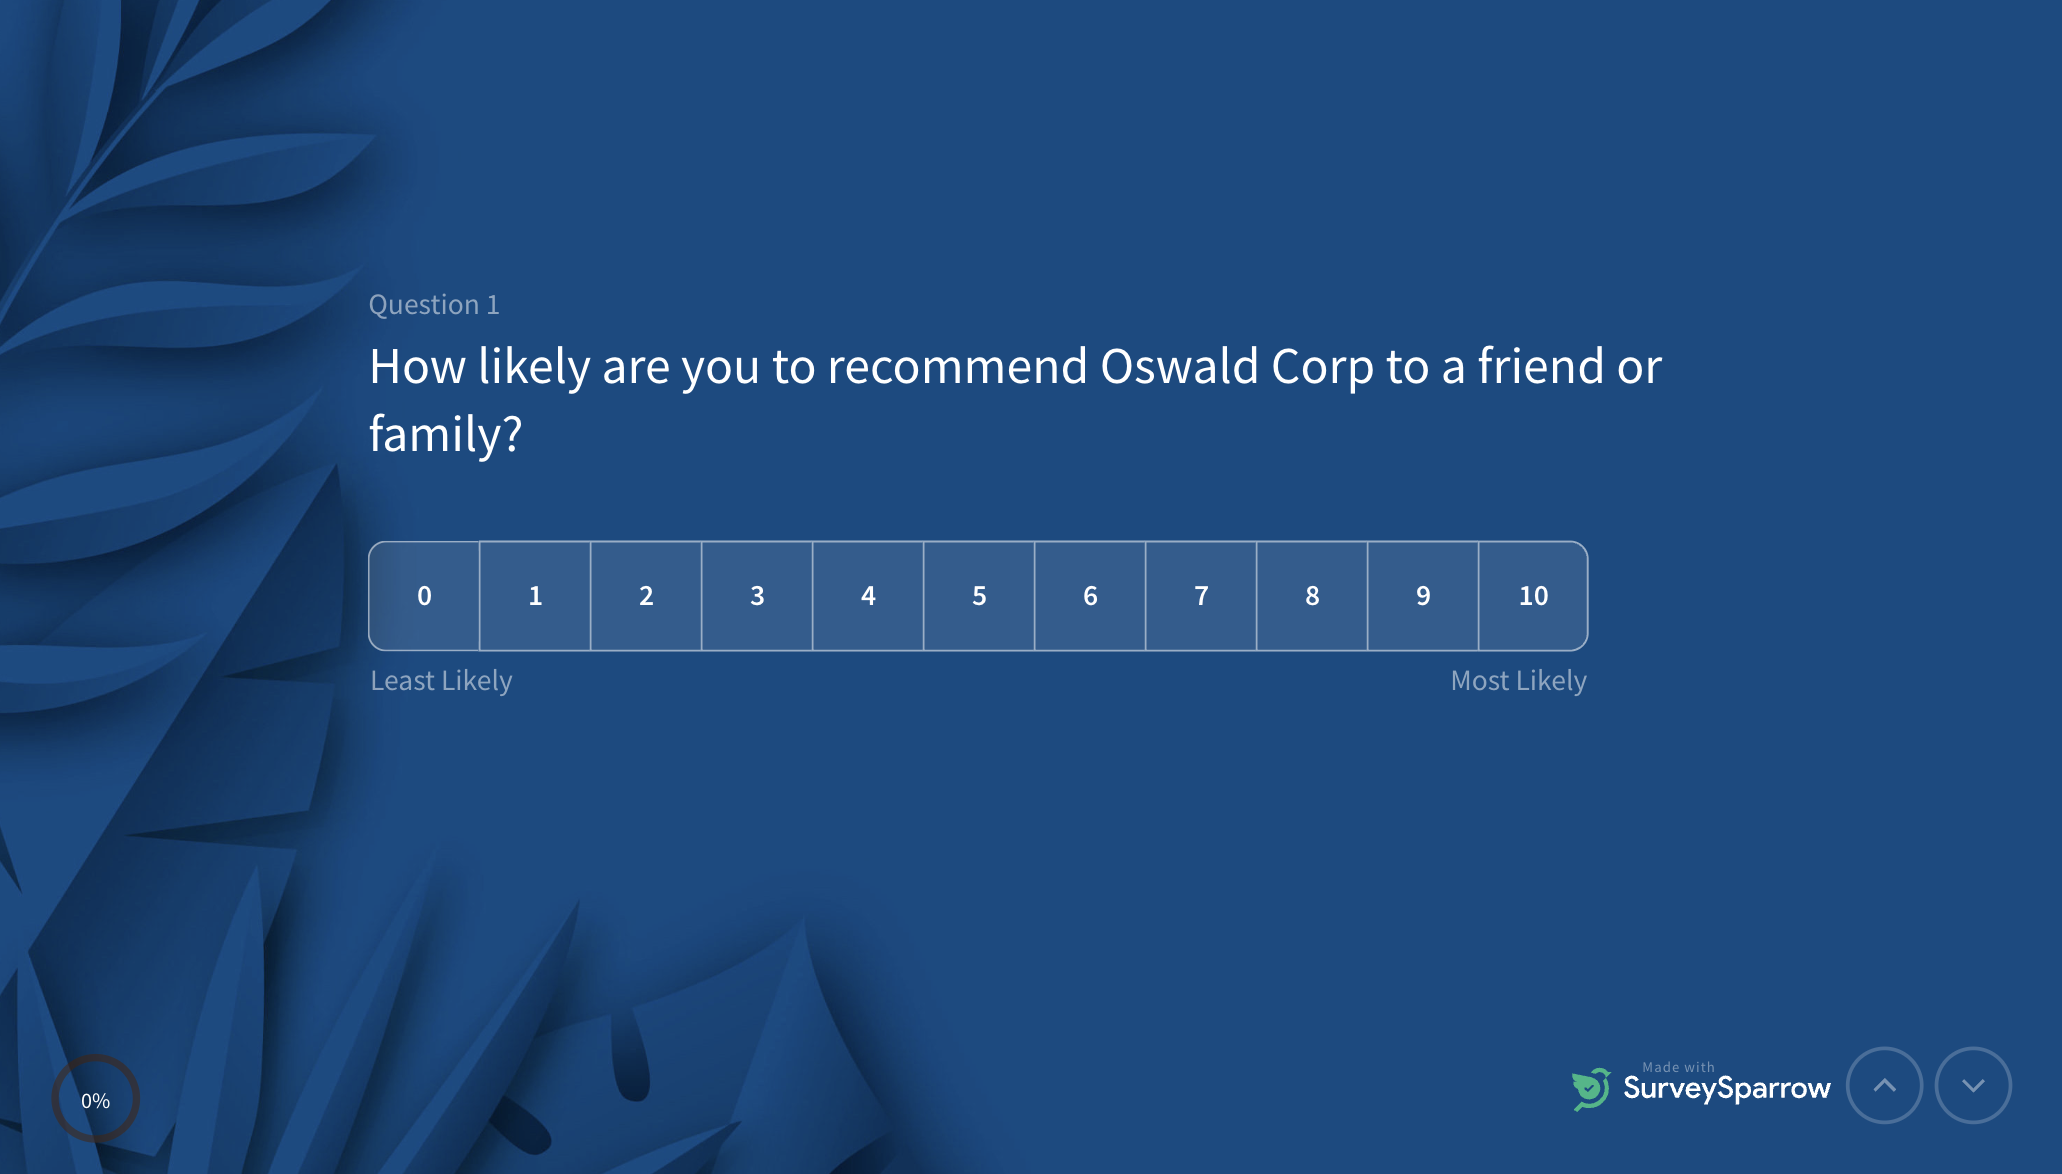
It looks something like this..
Plus, you can create your own surveys with the NPS Software by SurveySparrow. It is so easy to use! The intuitive platform makes it easy to create, distribute and analyze NPS surveys. Not enough? Well, there’s more. You can add dynamic lists and segments, conduct sentiment analysis and automate the surveys based on your preferences.
Give it a spin today!
Now, how should your company utilize the NPS metric?
You can calculate the Net Promoter Score based on the customers’ ratings to the question “How likely are you to recommend our service/brand/product to your family/friends/others on a scale of 1 to 10?”. Here, ‘1’ equates to ‘least likely’, and ‘10’ equates to ‘most likely’.
A lower NPS in the NPS chart is an indicator of potential customer loyalty and satisfaction issues. On the other hand, a higher NPS is an indicator of healthier business performance.
Before we go ahead, it is important that we know the answer to a crucial question. What’s that?
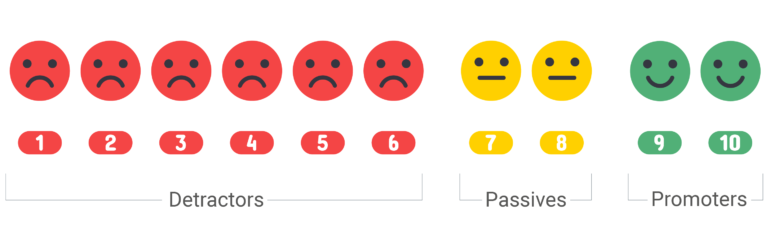
The answer to what can be called a “good” score can vary by industry and region. It typically falls between 0-30. Net promoter scores are categorized into three distinct sections:
Promoters (Score:9-10): These are highly satisfied customers who are likely to recommend your products and services to others. They are your most loyal audience or, to put it in other words, who can be considered your brand’s advocates.
Passives (Score: 7-8): These customers are satisfied with your brand but they are not enthusiastic enough to promote. Again, they might be less likely to promote your brand but it is highly unlikely that they’ll switch to a competitor.
Detractors (Score: 0-6): Okay, these are the customers that hold the power to tarnish your brand image. They might consider to switch to a competitor any chance they get. So, beware. They are dissatisfied with your product or service that they might even share negative feedback.
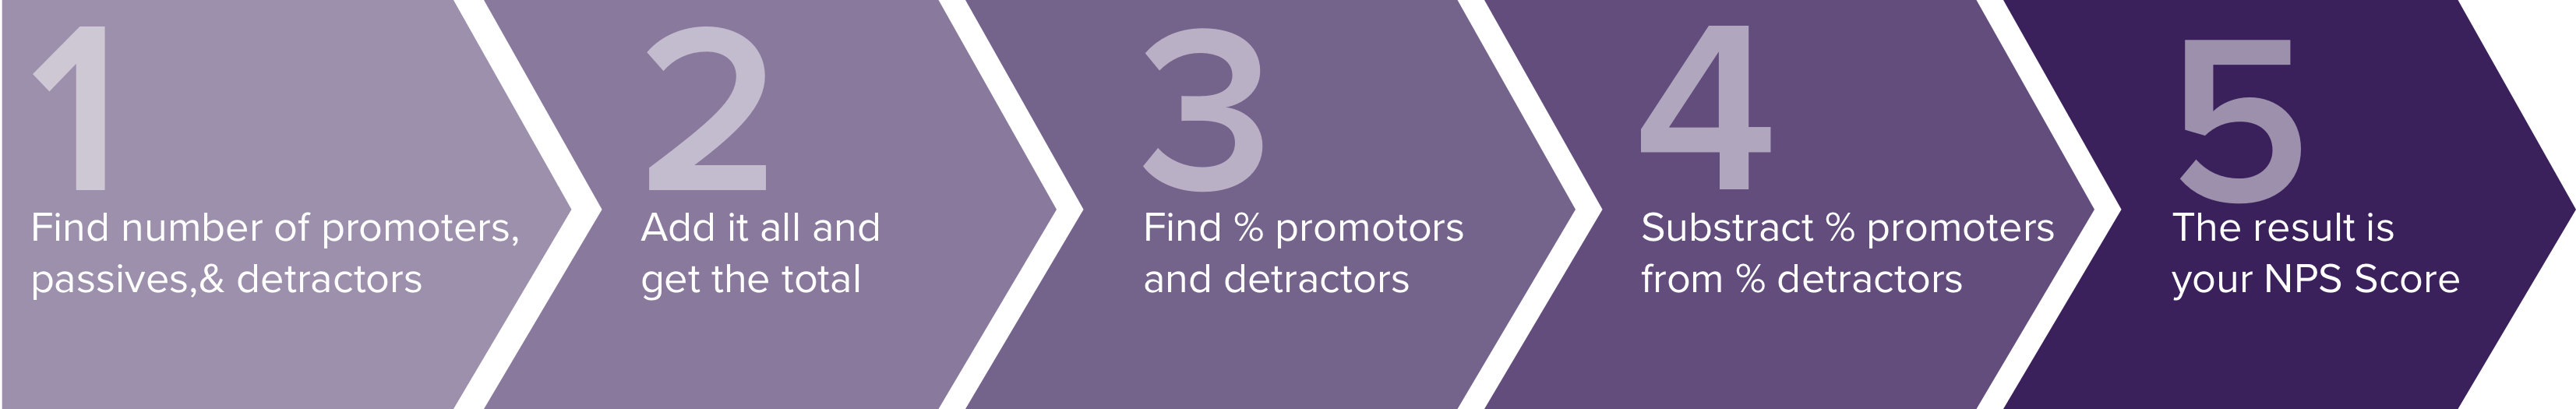
When it comes to calculating the NPS score, you know the drill right? The formula is pretty straightforward. Subtract the percentage of detractors from the percentage of promoters.
NPS= (% of Promoters) – (% of Detractors)
So, let’s say you have 70% promoters and 10% detractors. Your NPS would be +60 (70% – 10% = 60). It’s as simple as that!
After NPS calculation, employees can use the NPS scores to identify the potential gaps and improve the existing products/services for the best customer experience statistics in the long term. This, in turn, will increase the revenues and profits for the company.
But what’s a good NPS benchmark after all? There are two possibilities:
However, the Net Promoter Score itself seems a little meaningless at times. We need to view it more as a qualitative metric than a quantitative metric. More over, there are variations in the NPS calculations based on the various stages of the customer experience life cycle (Bain & Company):
There are many different ways to visualize NPS, depending upon what elements you want to lay emphasis on. At times, it’s best to go for a net promoter score chart to summarize the extracted data. Visualizing NPS scores through graphs are significant as different distributions of respondent segments can lead up to the same score. Hence, the visualization technique is used to get a more holistic view of your customer’s loyalty and advocacy.
Let’s check out the most common net promoter score charts:
NPS surveys are relatively easy to create, but you must give a serious thought on how you want to administer it. A well-structured NPS survey goes a long way in getting the right results for your business. You can use an ideal NPS software or a modern CEM platform to design the survey questions to get a more comprehensive perspective on your customers, be it the current or potential ones. Examples can be to identify the communication channel that your customer uses, his personal details, etc. Once this is done, you can use different reporting tools to analyze the data for underlying issues and strategic trends.
You can create more promoters for your business by kick-starting specific types of net promoter score questions and programs. The two most popular types are Transactional NPS Surveys & Relational NPS Surveys. You can use a combination of both to understand your customers at a micro as well as at a macro level.
Do keep in mind that the NPS software you choose must be compatible with reporting tools such as BI and SQL. The main reason behind this being it will allow you to combine your NPS data with other customer data thus assisting you in NPS calculation.
The frequency of the NPS survey varies according to the business model:
You can review four kinds of data that are collected through your NPS survey:
Cross-Reference NPS Data with Other Related Key KPIs
NPS scores have great value, but they become even more significant when seen in connection with other key KPIs. Cross-referencing variables can unravel hidden linkages and explanations to questions that can’t be answered directly.
Let’s dive into some of these variables briefly.
To achieve exceptional results for your business, it is critical to adopt some best practices when you design the whole NPS question process and survey. Let’s list down some of the best practices first:

We assume that by now, you must have got a fairly good idea about what NPS is all about and how to look at your NPS data.
To summarise, NPS calculation certainly has proven its worth, given the fact that big companies are using it on a continuous basis to track its customers, maintain strong customer relationships, and keep them satisfied. An NPS software is highly functional when combined with other key metrics and easily interpretable by anyone.
Last but not least, NPS scores help organizations to identify and assess the stage it is at in the entire business growth process. Based on this, they can devise and implement actions to boost the NPS. Remember that your main goal is to always listen to your customers’ voice and act on it.
So, perform your Net Promoter Score calculation today and look into the score insights to produce long-term customer success and achieve high business growth.

Thousands of brands trust SurveySparrow to turn feedback into growth. Try it free today!
: The Ultimate Beginner's Guide!")
Best Of
15 MINUTES
25 July 2019

Best Of
13 MINUTES
24 April 2020

Best Of
9 MINUTES
19 August 2020

Best Of
7 MINUTES
7 August 2020
14-day free trial • Cancel Anytime • No Credit Card Required • No Strings Attached
14-day free trial • Cancel Anytime • No Credit Card Required • No Strings Attached