Best Of
Top 10 Data Analytics Tools: Insights with Advanced Analytical Solutions
Article written by Kate Williams
Content Marketer at SurveySparrow
17 min read
28 June 2024


Best Of
Article written by Kate Williams
Content Marketer at SurveySparrow
17 min read
28 June 2024
It’s a known fact that data analytics tools help you climb the ladder of productivity. Similarly, the importance of data collection and analysis is not an alien topic. What triggers most of us is this question:
How do you choose the best tool among the plethora of options available in the online market?
This blog will look deeper into the top ten data analytics tools, their features, pricing, and all you need to know about them.
Off we go!
Data analytics tools employ advanced algorithms and statistical methods to interpret complex data sets. They take all the information available and transform it into actionable insights.
Analytical tools tell you what’s going on. Imagine having an expert guide you through your decisions!
Whether it’s figuring out what customers like or guessing what might happen next, these tools act as your strategic ally.
Thinking that’s a bit much, huh? Wait until I walk you through the array of features each one offers.
When you’re on the lookout for a perfect match, make sure these points fulfill the checklist.
1. User-Friendly Interface: Look for tools that have an easy-to-use interface. A good data analytics tool should be a friendly guide, not a confusing puzzle. You want to click and explore without needing a tech degree!
2. Real-Time Updates: Find a tool that gives you information when needed. It’s like having a live chat with your data, where the numbers talk to you instantly. No more waiting – get updates as they happen.
3. Customizable Dashboards: Your data is unique, so it should be your tool. Look for tools that let you create dashboards that fit your business needs. It’s like arranging your favorite apps on your phone – everything where you want it.
4. Predictive Analytics: A promising tool should be like a fortune teller for your business. It predicts what might happen next based on your data. It’s not magic, just intelligent algorithms working behind the scenes.
5. Collaboration Tools: Business is a team effort; your data tool should support that. Look for tools that let your team work together on the data. It’s like having a shared whiteboard where everyone adds their insights.
Since that’s covered, how about we discuss the ten elephants in the room?
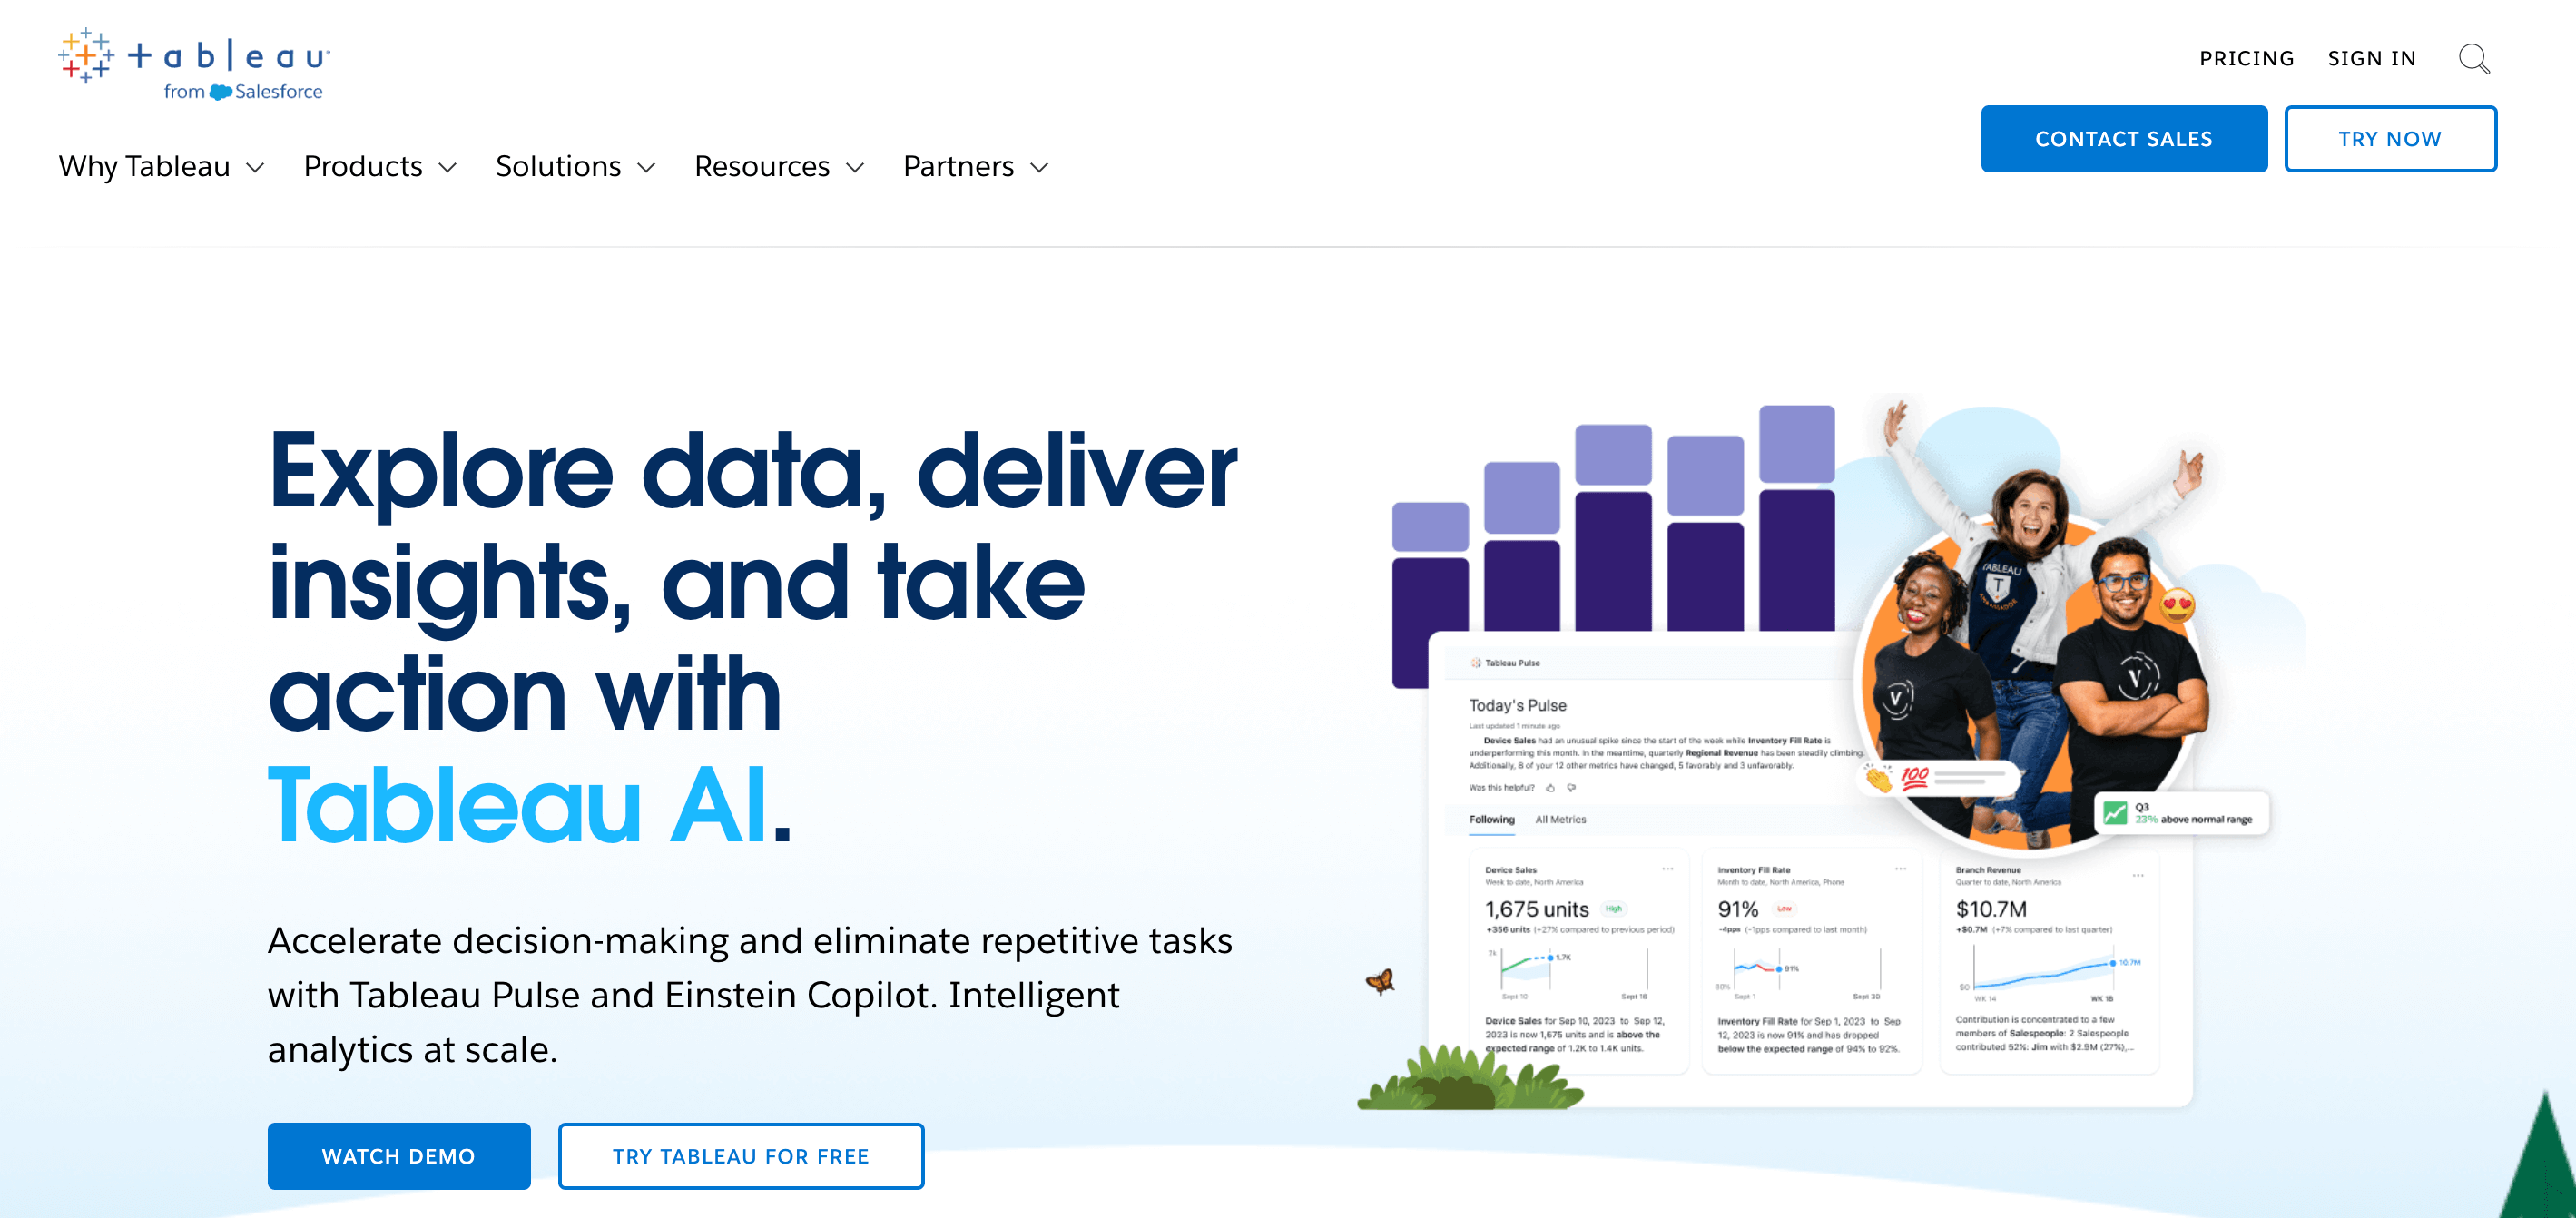
No tech jargon – that’s the best part about Tableau. It offers a user-friendly experience where you can drag and drop your way to valuable insights. Tableau is your go-to companion if you wish to make your business more data-driven. It takes all kinds of data from almost anywhere and transforms it into actionable insights with incredible speed and simplicity.
Ideal for: Tableau is for everyone! Whether you’re a small business just starting or a big company, it fits right in and makes your work easier.
Pricing: Contact the team for a quote
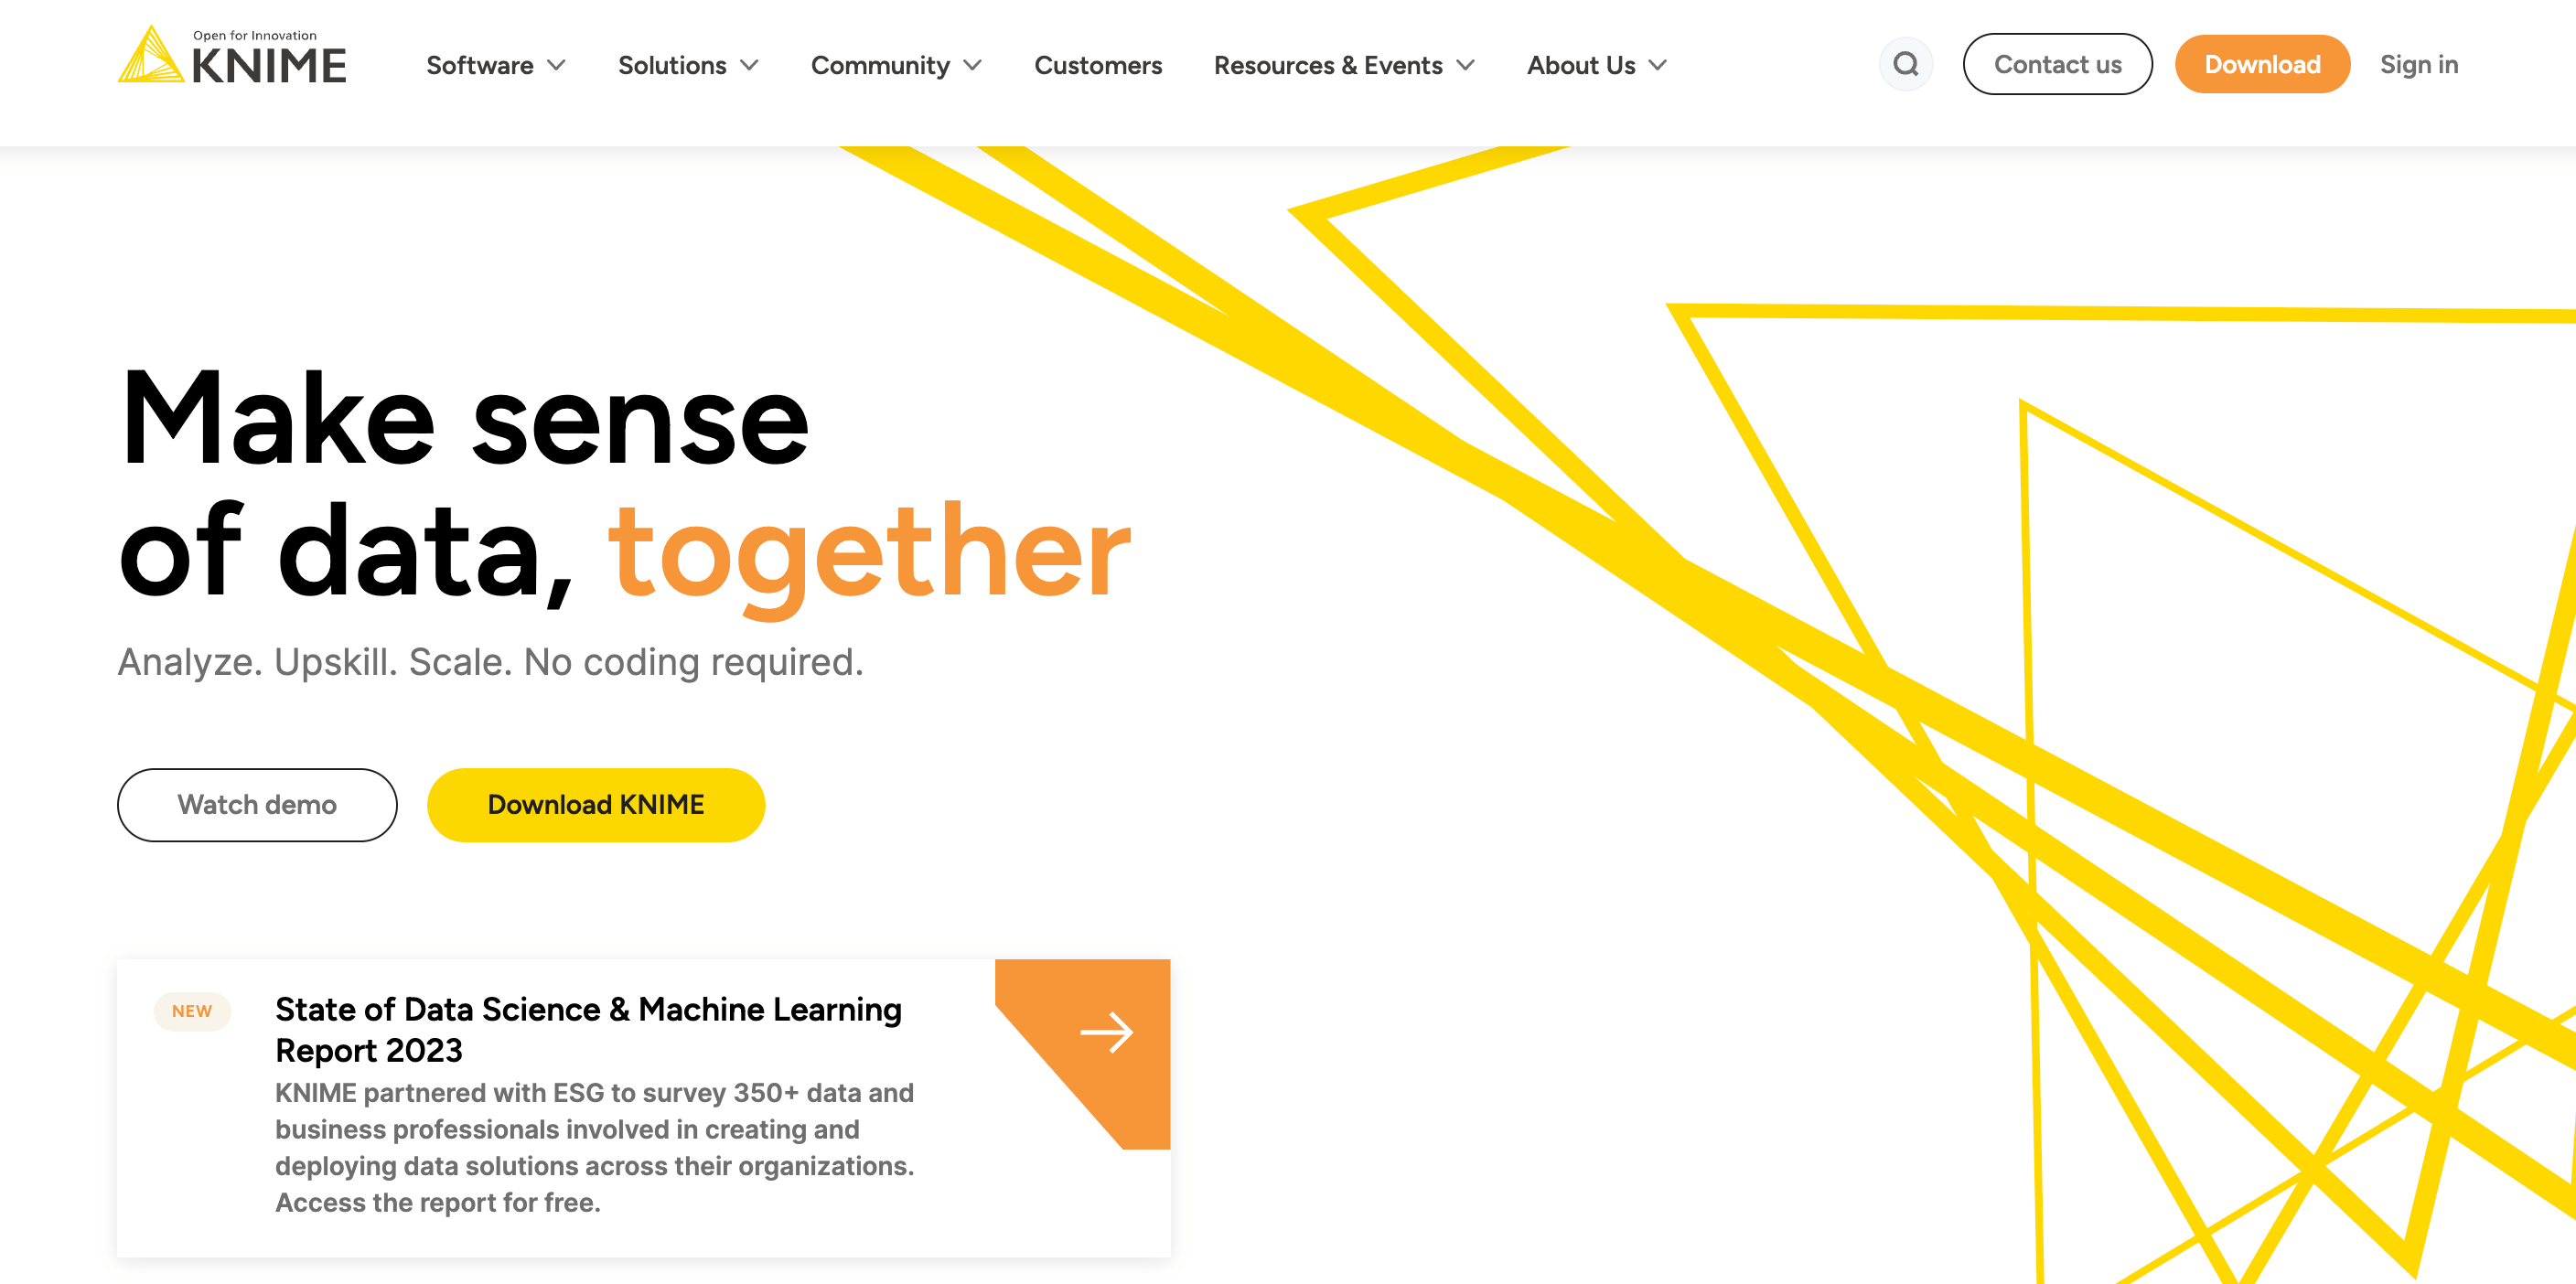
KNIME is short for Konstanz Information Miner. It is a data analytics, reporting, and integration platform that provides a range of tools for data science. The platform is mainly known for its user-friendly visual workflow builder.
It is a dreamland for analysts. Why? Because it is a free and open-source platform.
Ideal for: As mentioned above, it’s a free and open-source platform. It is for anyone eager to get into the world of data science.
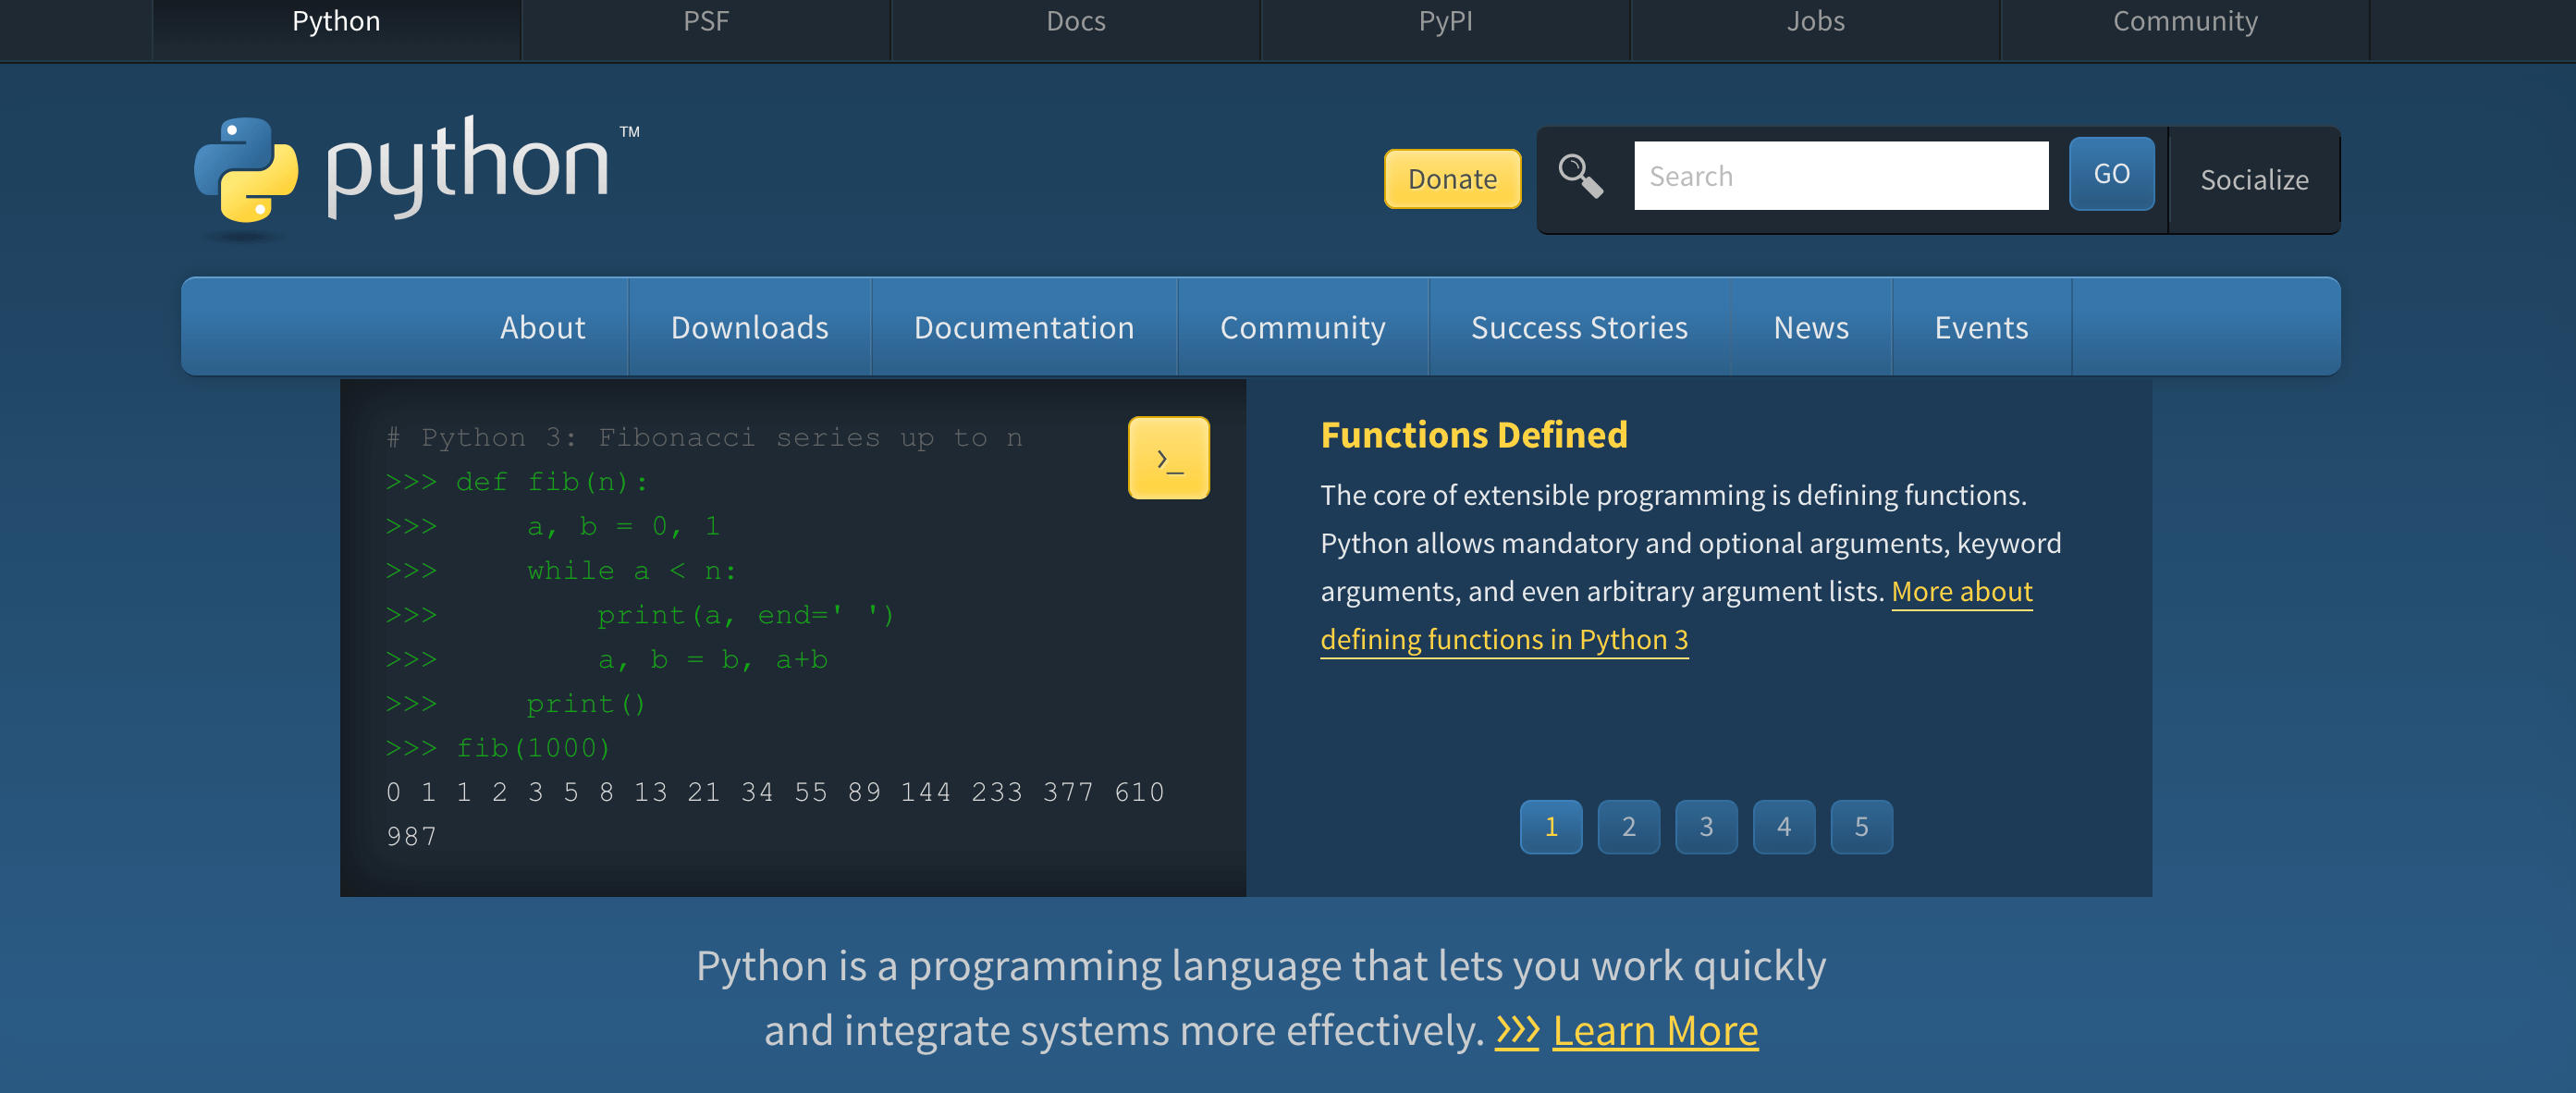
There you go, another open-source platform. Python is a high-level programming language that goes beyond just code. Data scientists adore it because of the vast libraries such as NumPy, Pandaa, and Matplotlib. Whether data manipulation, computation, visualization, or reporting, the platform covers you.
Ideal for: Anyone who is eager to learn!
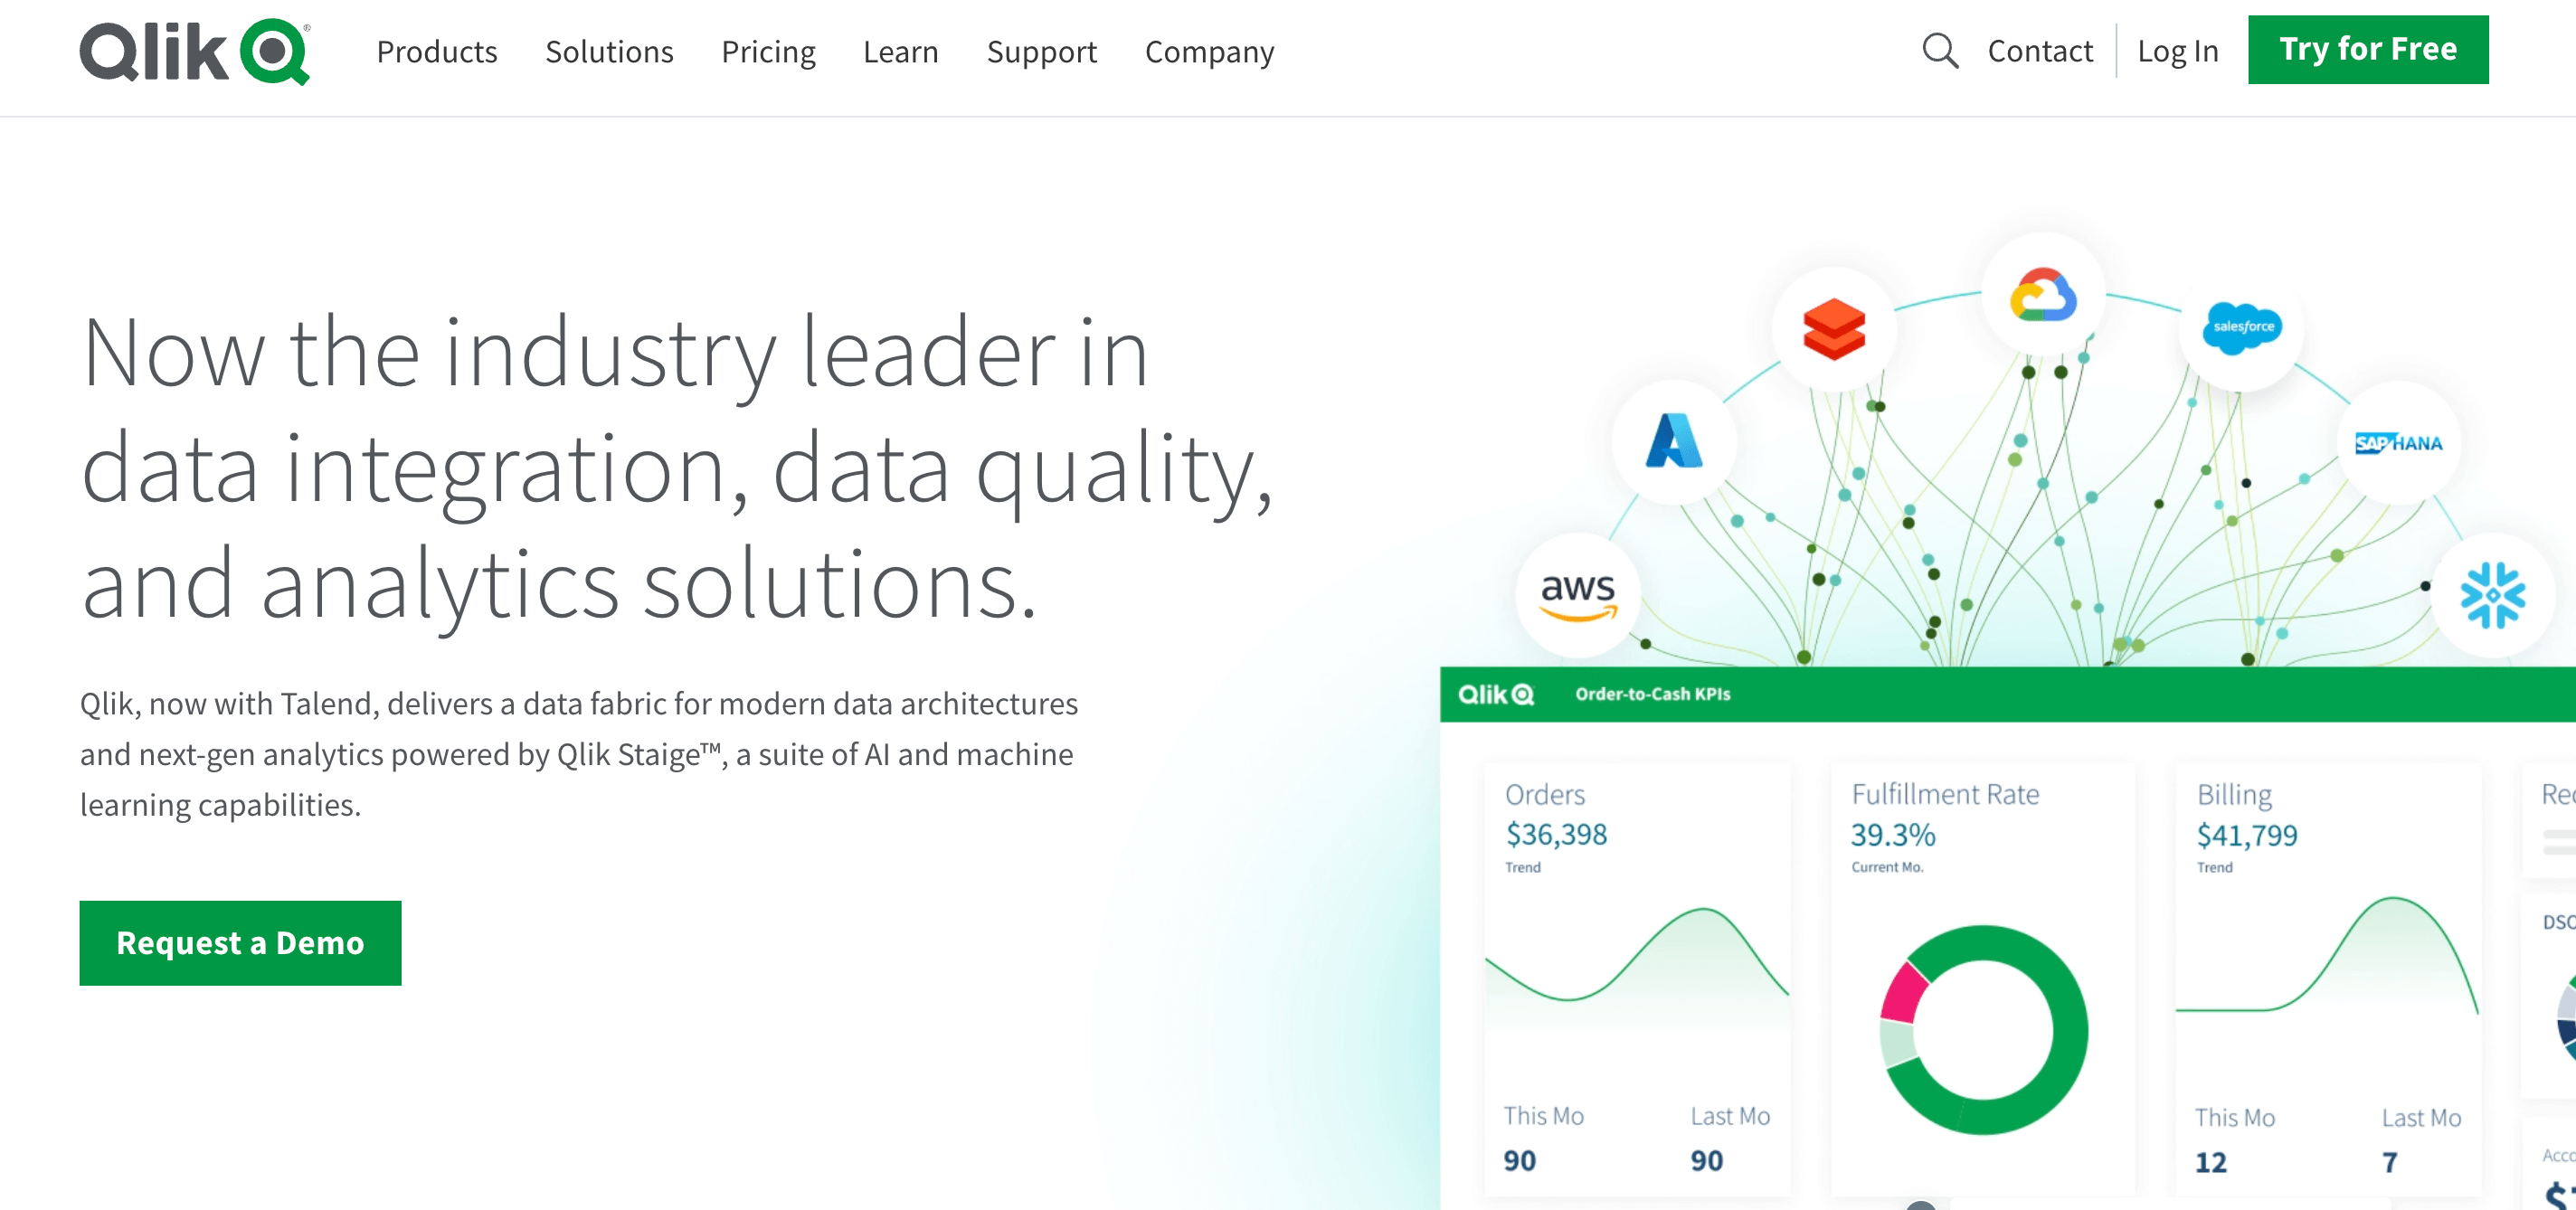
Qlik acquired Talend in 2023 and became one of the sought-after data analytics platforms. Why not? Now you get the scalability of Talend and the next-gen capabilities of Qlik in one place! Plus, the analytics platform provides agility for data professionals. And did you know it was formerly called Qliktech?
Ideal for: The suite is perfect for businesses aiming to capture impeccable data!
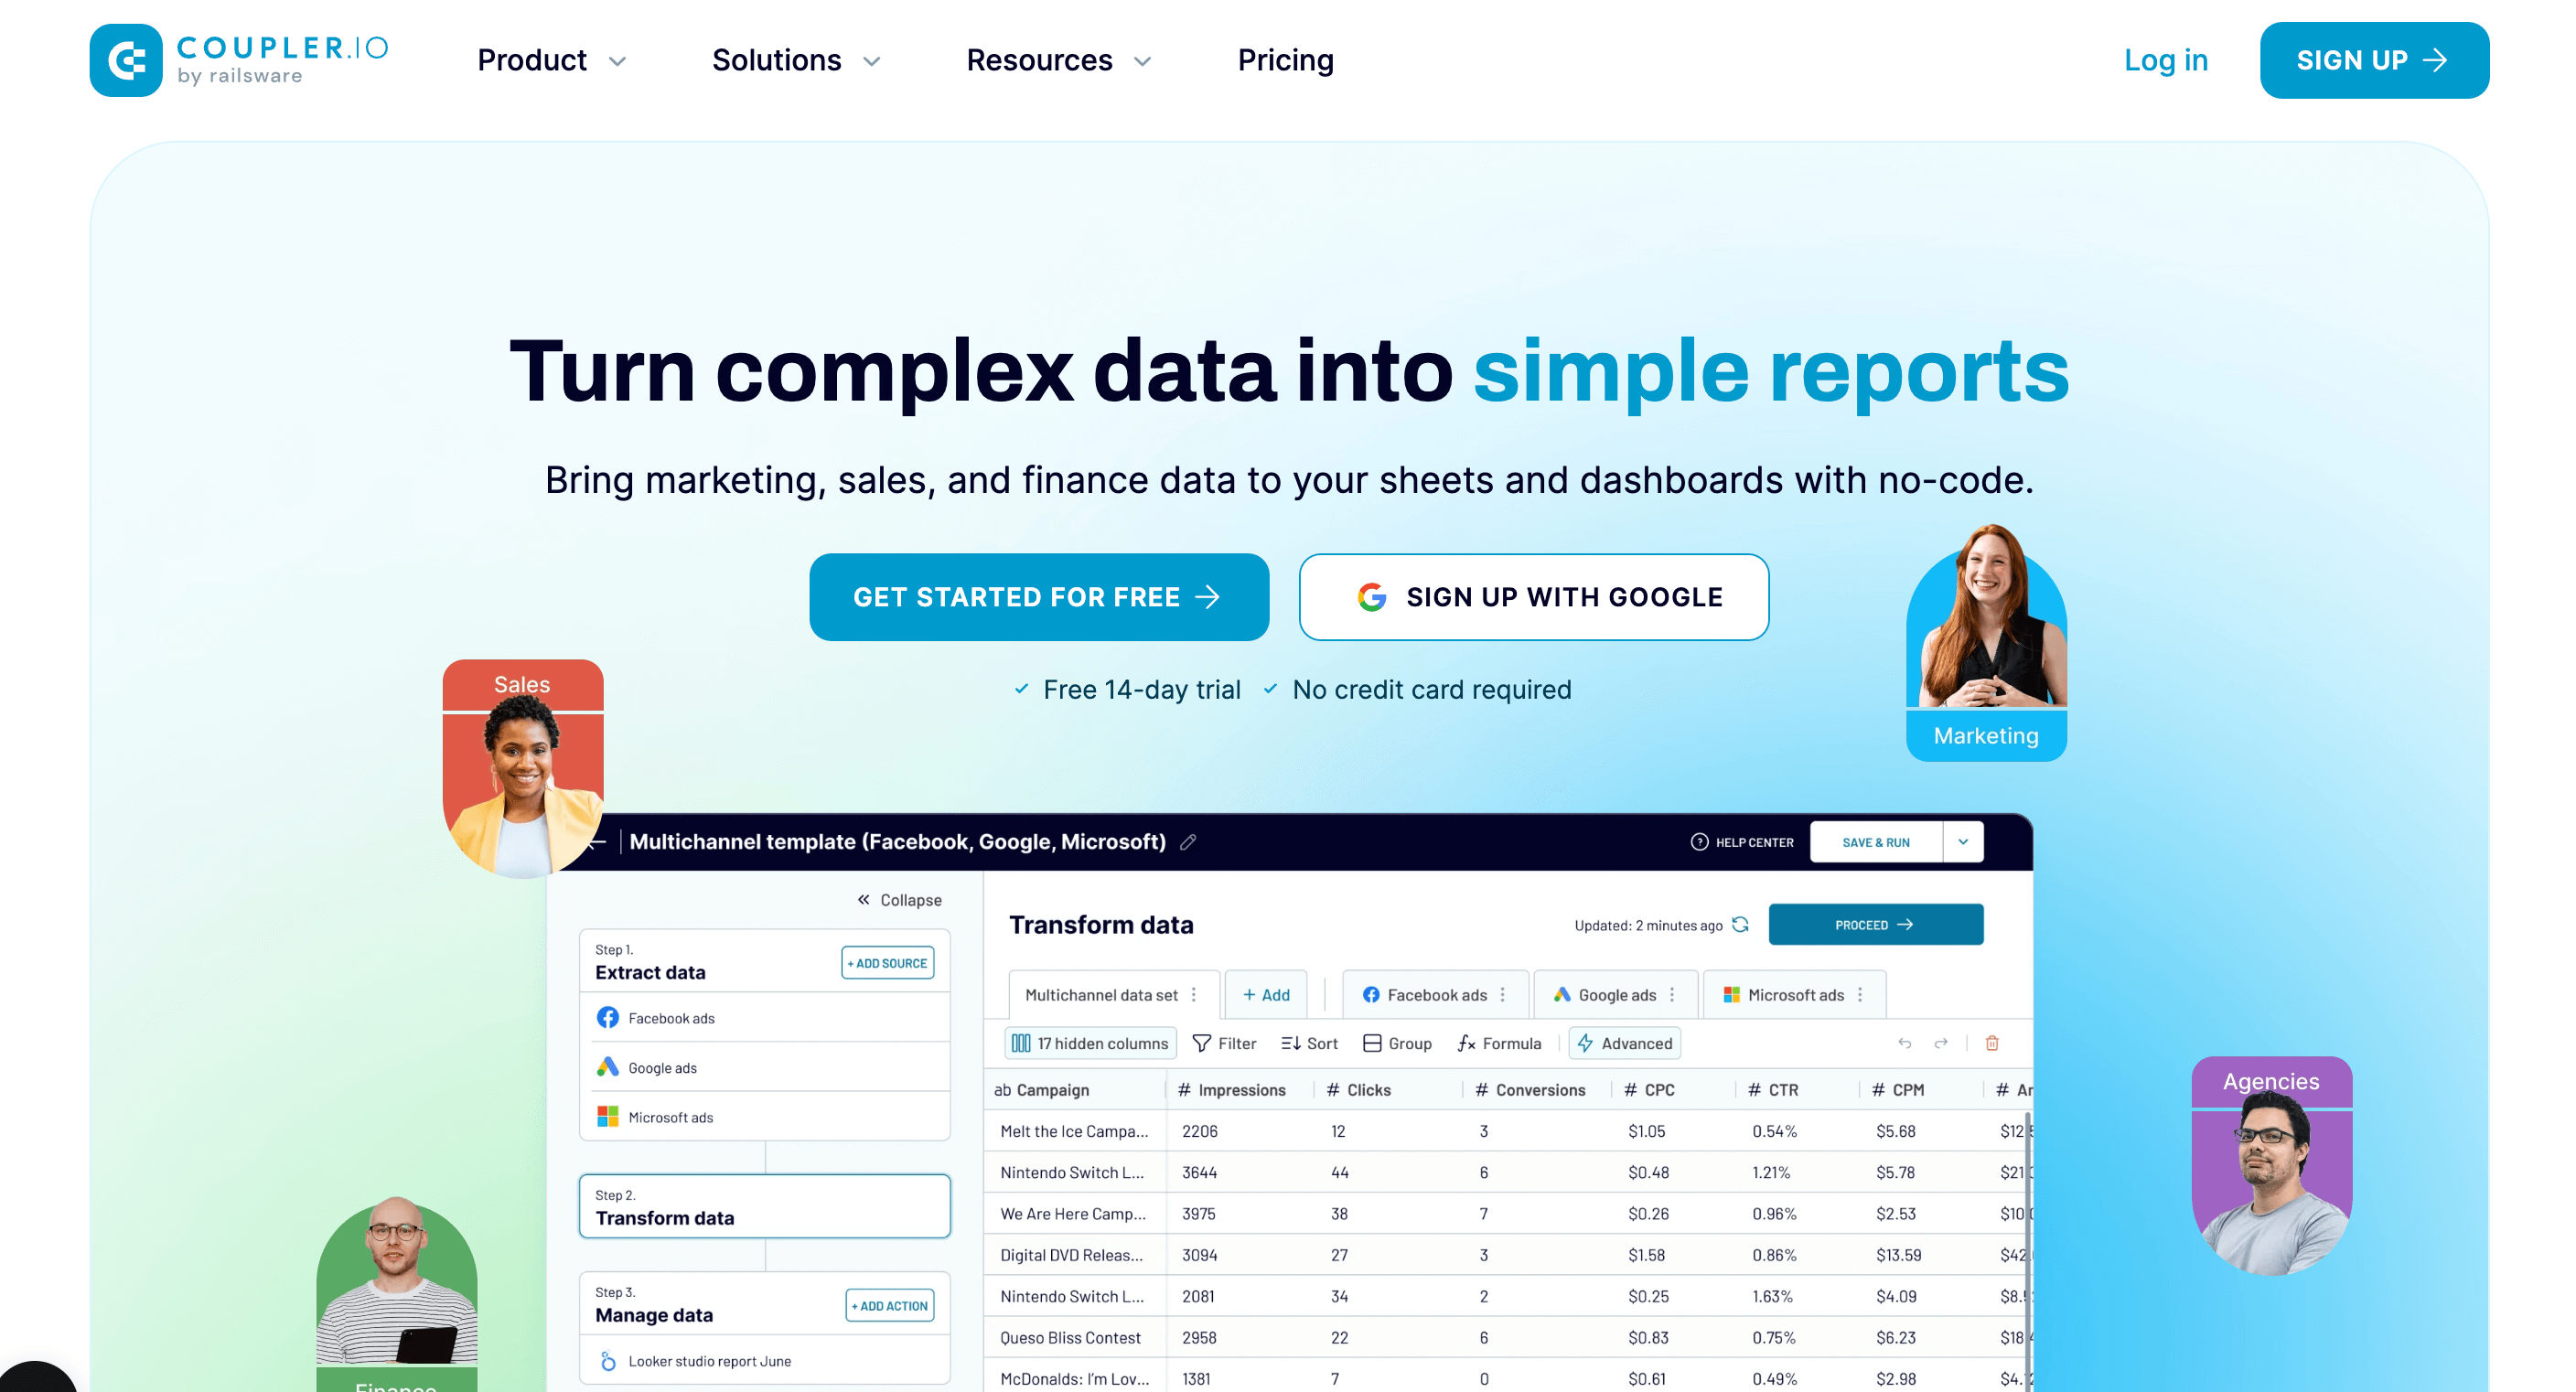
Coupler.io is a no-code data analysis and reporting platform built by Railsware in 2020. This data analytics tool provides full capabilities to gather, transform, manage, and visualize business data. The ETL part of the solution allows for the export and combining of data from various apps. At the same time, the analysis side opens a way to display those records in comprehensive reports and dashboards.
Key features:
Ideal for: Marketing teams and agencies, businesses, and departments needing a simple yet solid reporting and performance analytics solution.
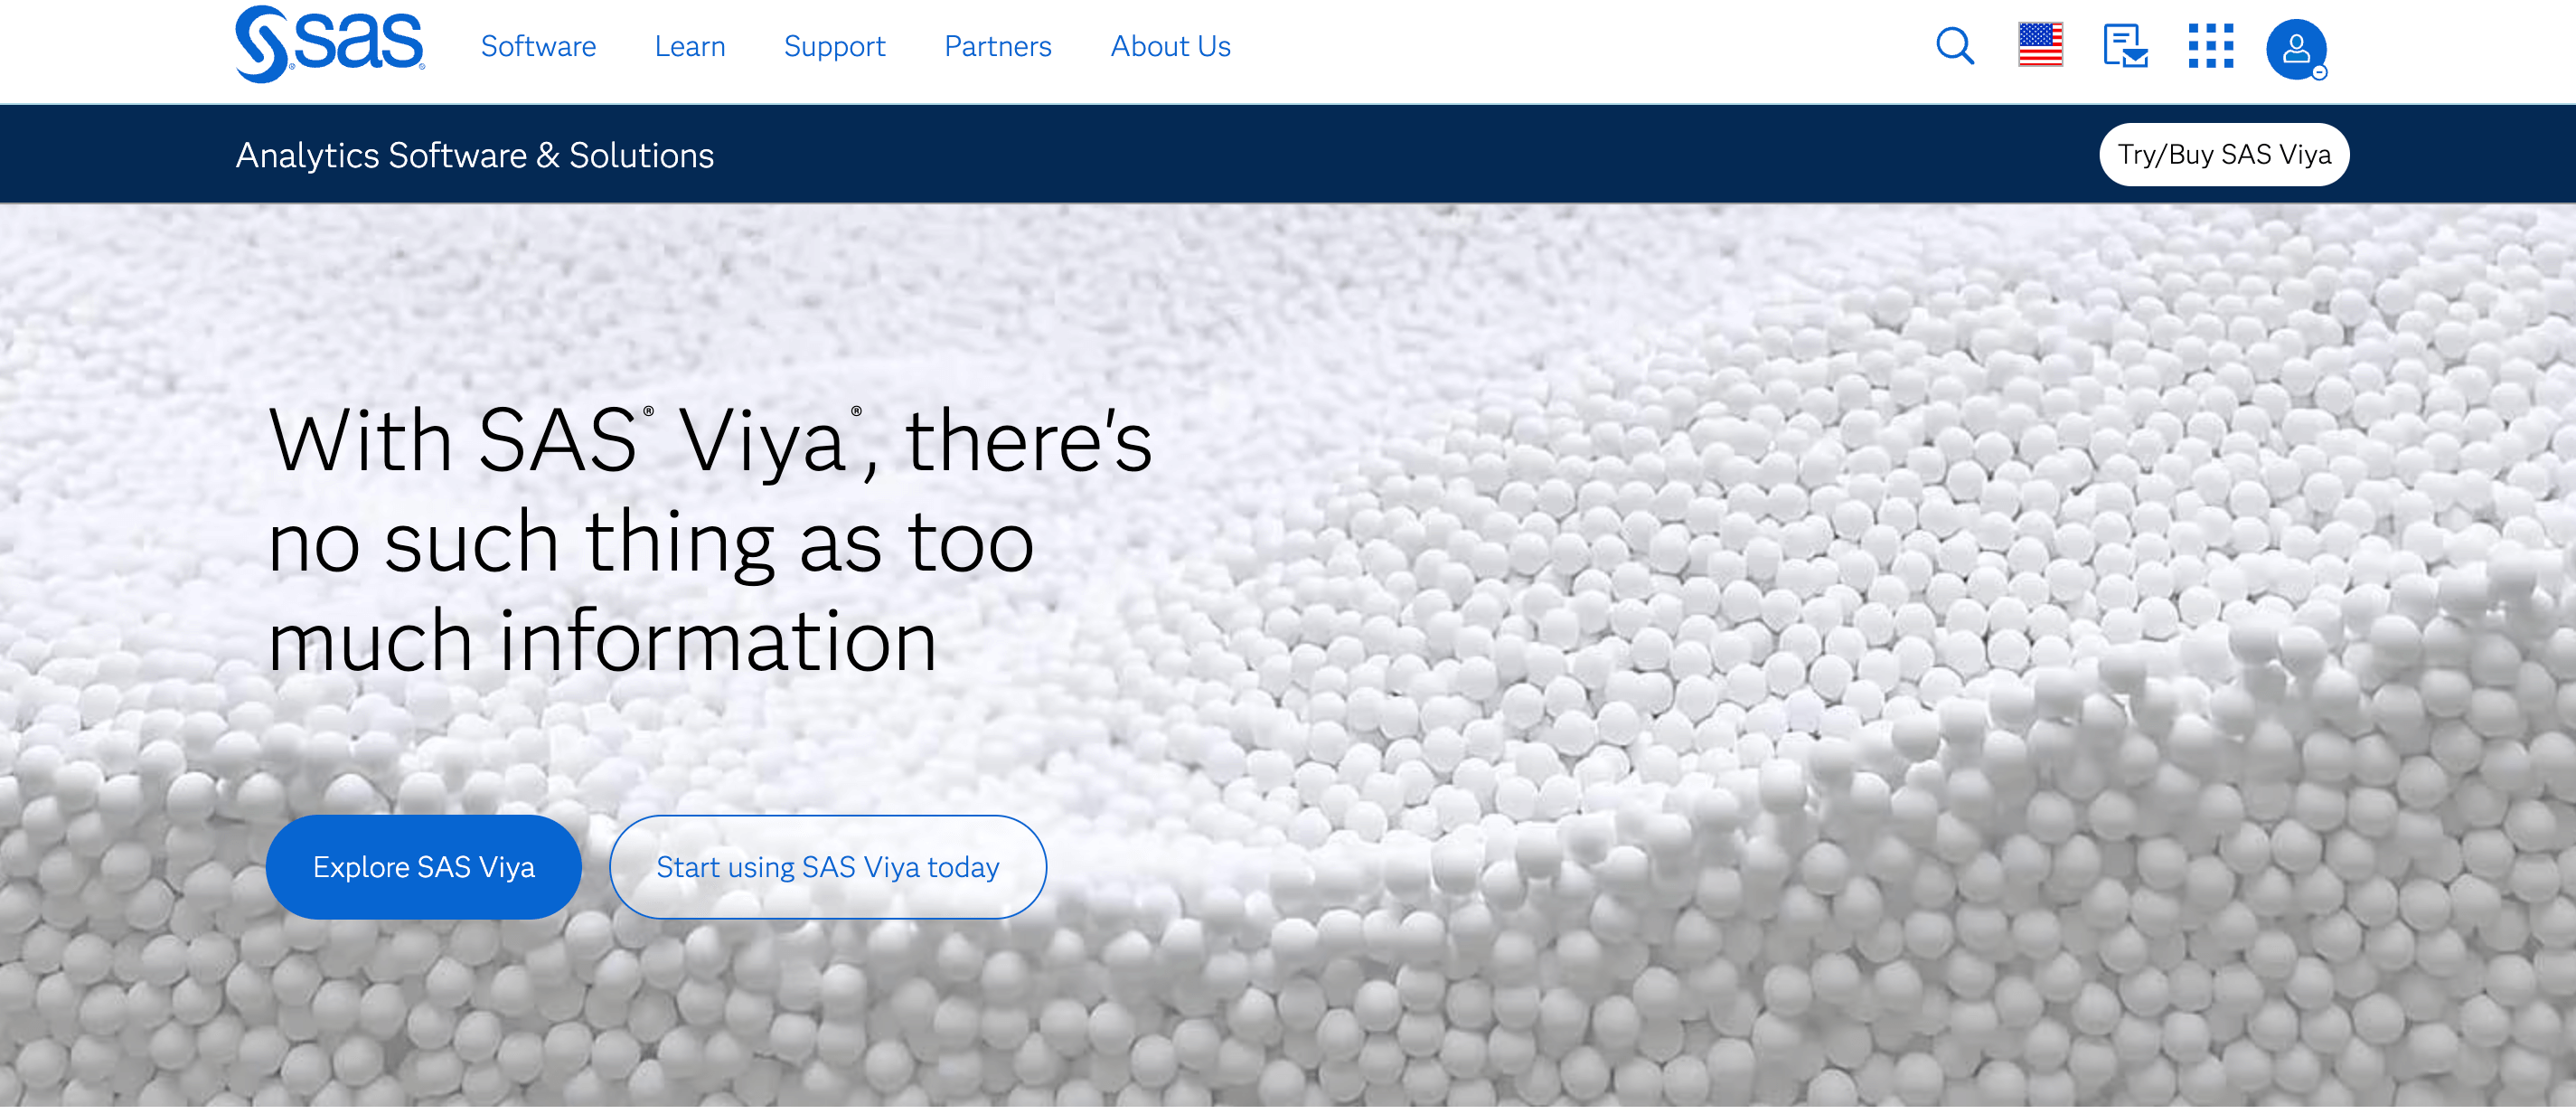
As their tagline states, there is nothing called “too much data.” (Well, not unless you have advanced data analytics tools to back you up!)
Just imagine having to source and proofread a billion data points! Impractical, right? SAS helps you tone them down to well-informed perspectives. It is an AI and analytics platform that makes data analysts faster, more scalable, and undeniably productive!
Ideal for: As the name suggests, it is more suitable for those in the field of statistics.
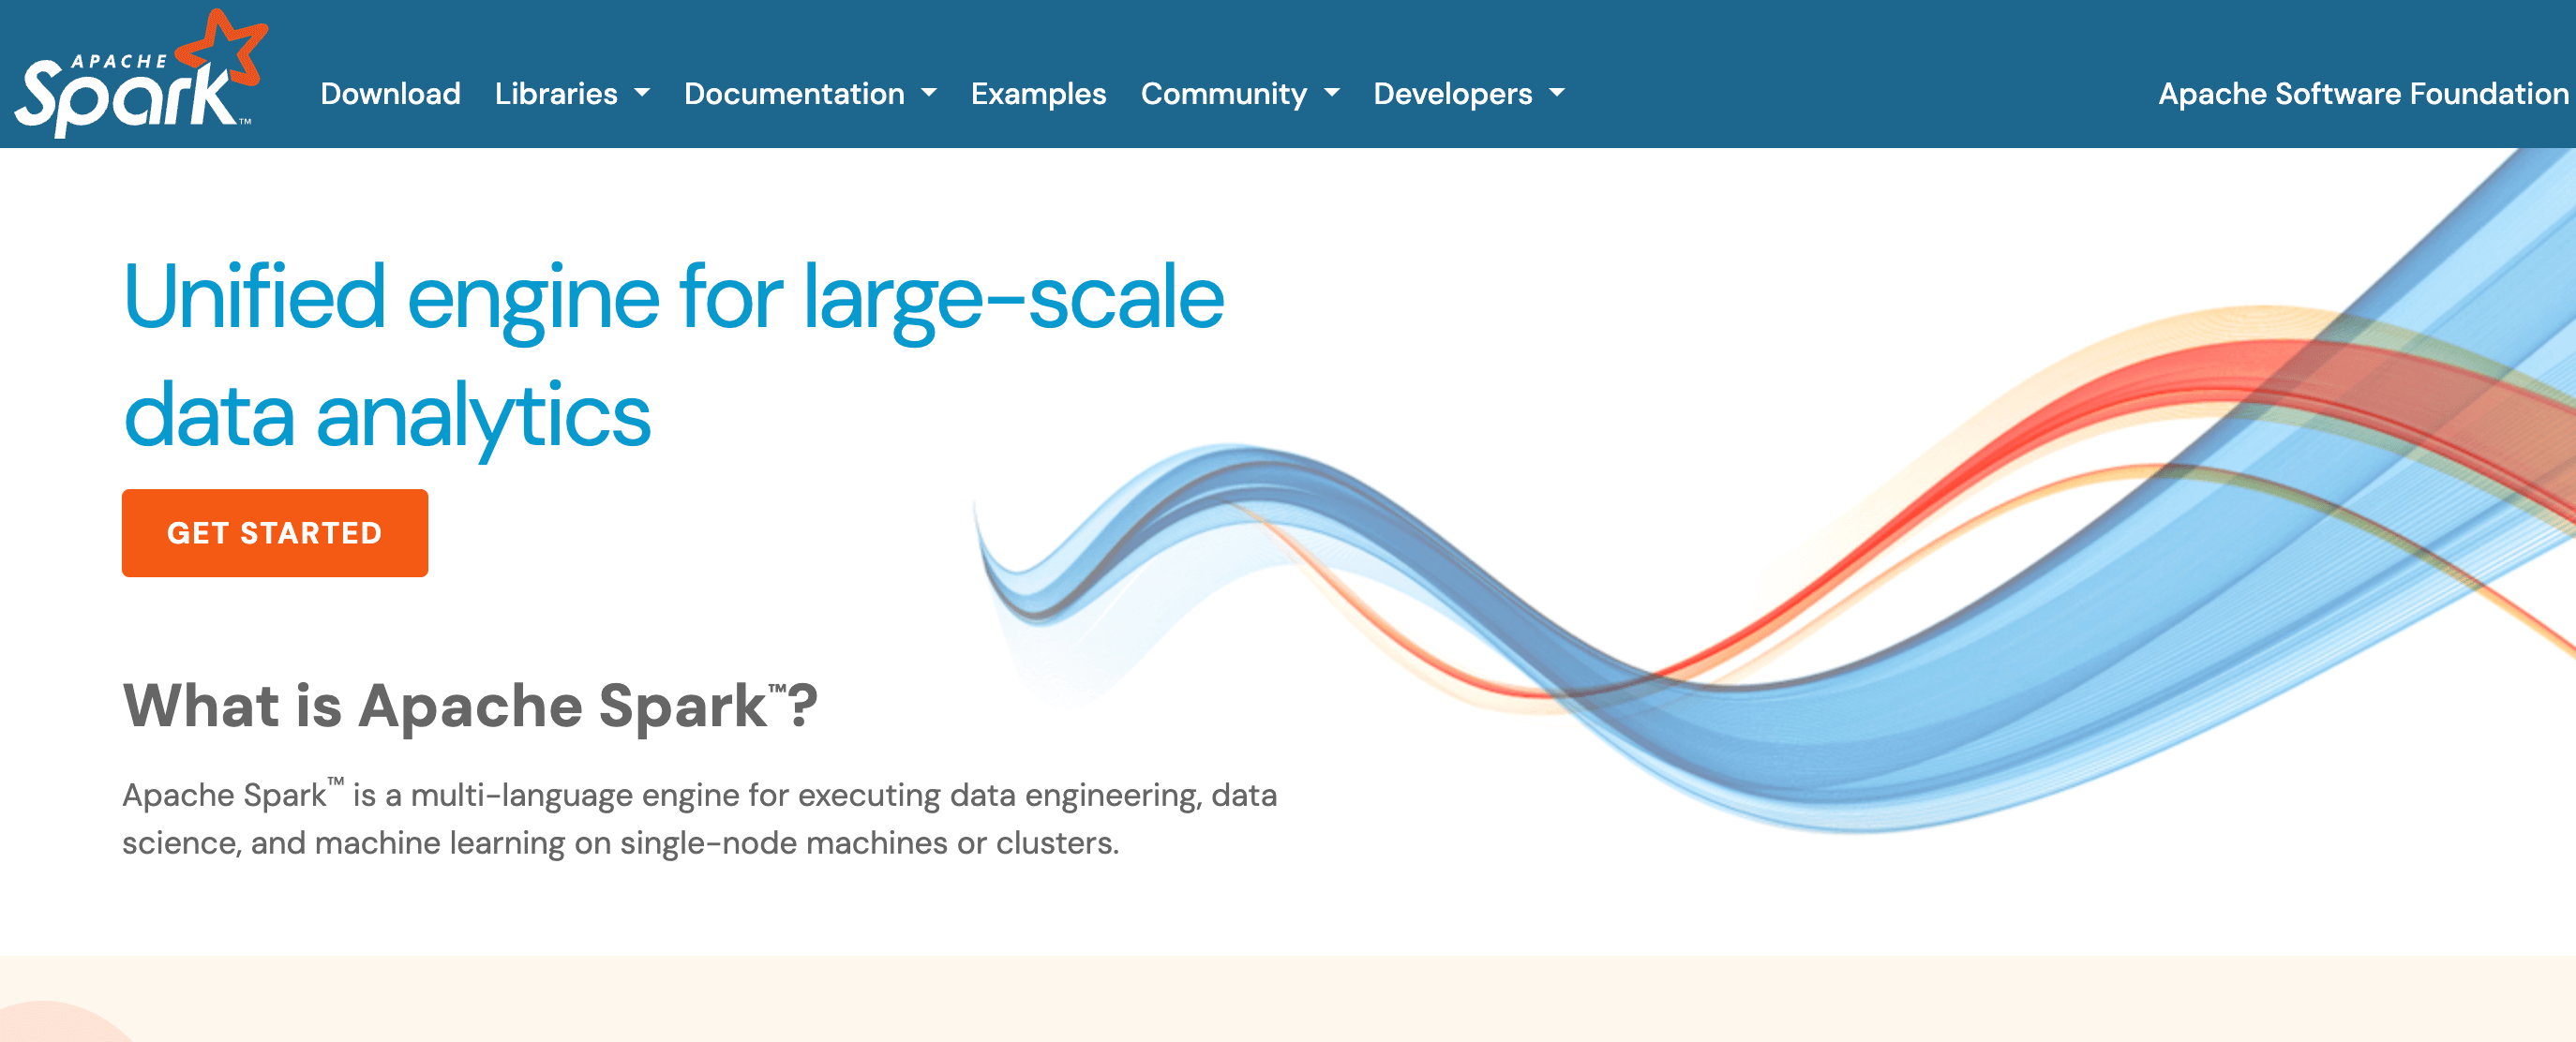
Whether diving into data engineering, exploring data science, or delving into machine learning, Spark™ is a versatile and unified engine. It is the go-to solution for large-scale data analytics. The best part? It offers simplicity, speed, and scalability. Also, it is an open-source platform.
Ideal for: This tool is for you if you want a unified engine for large-scale data analytics.
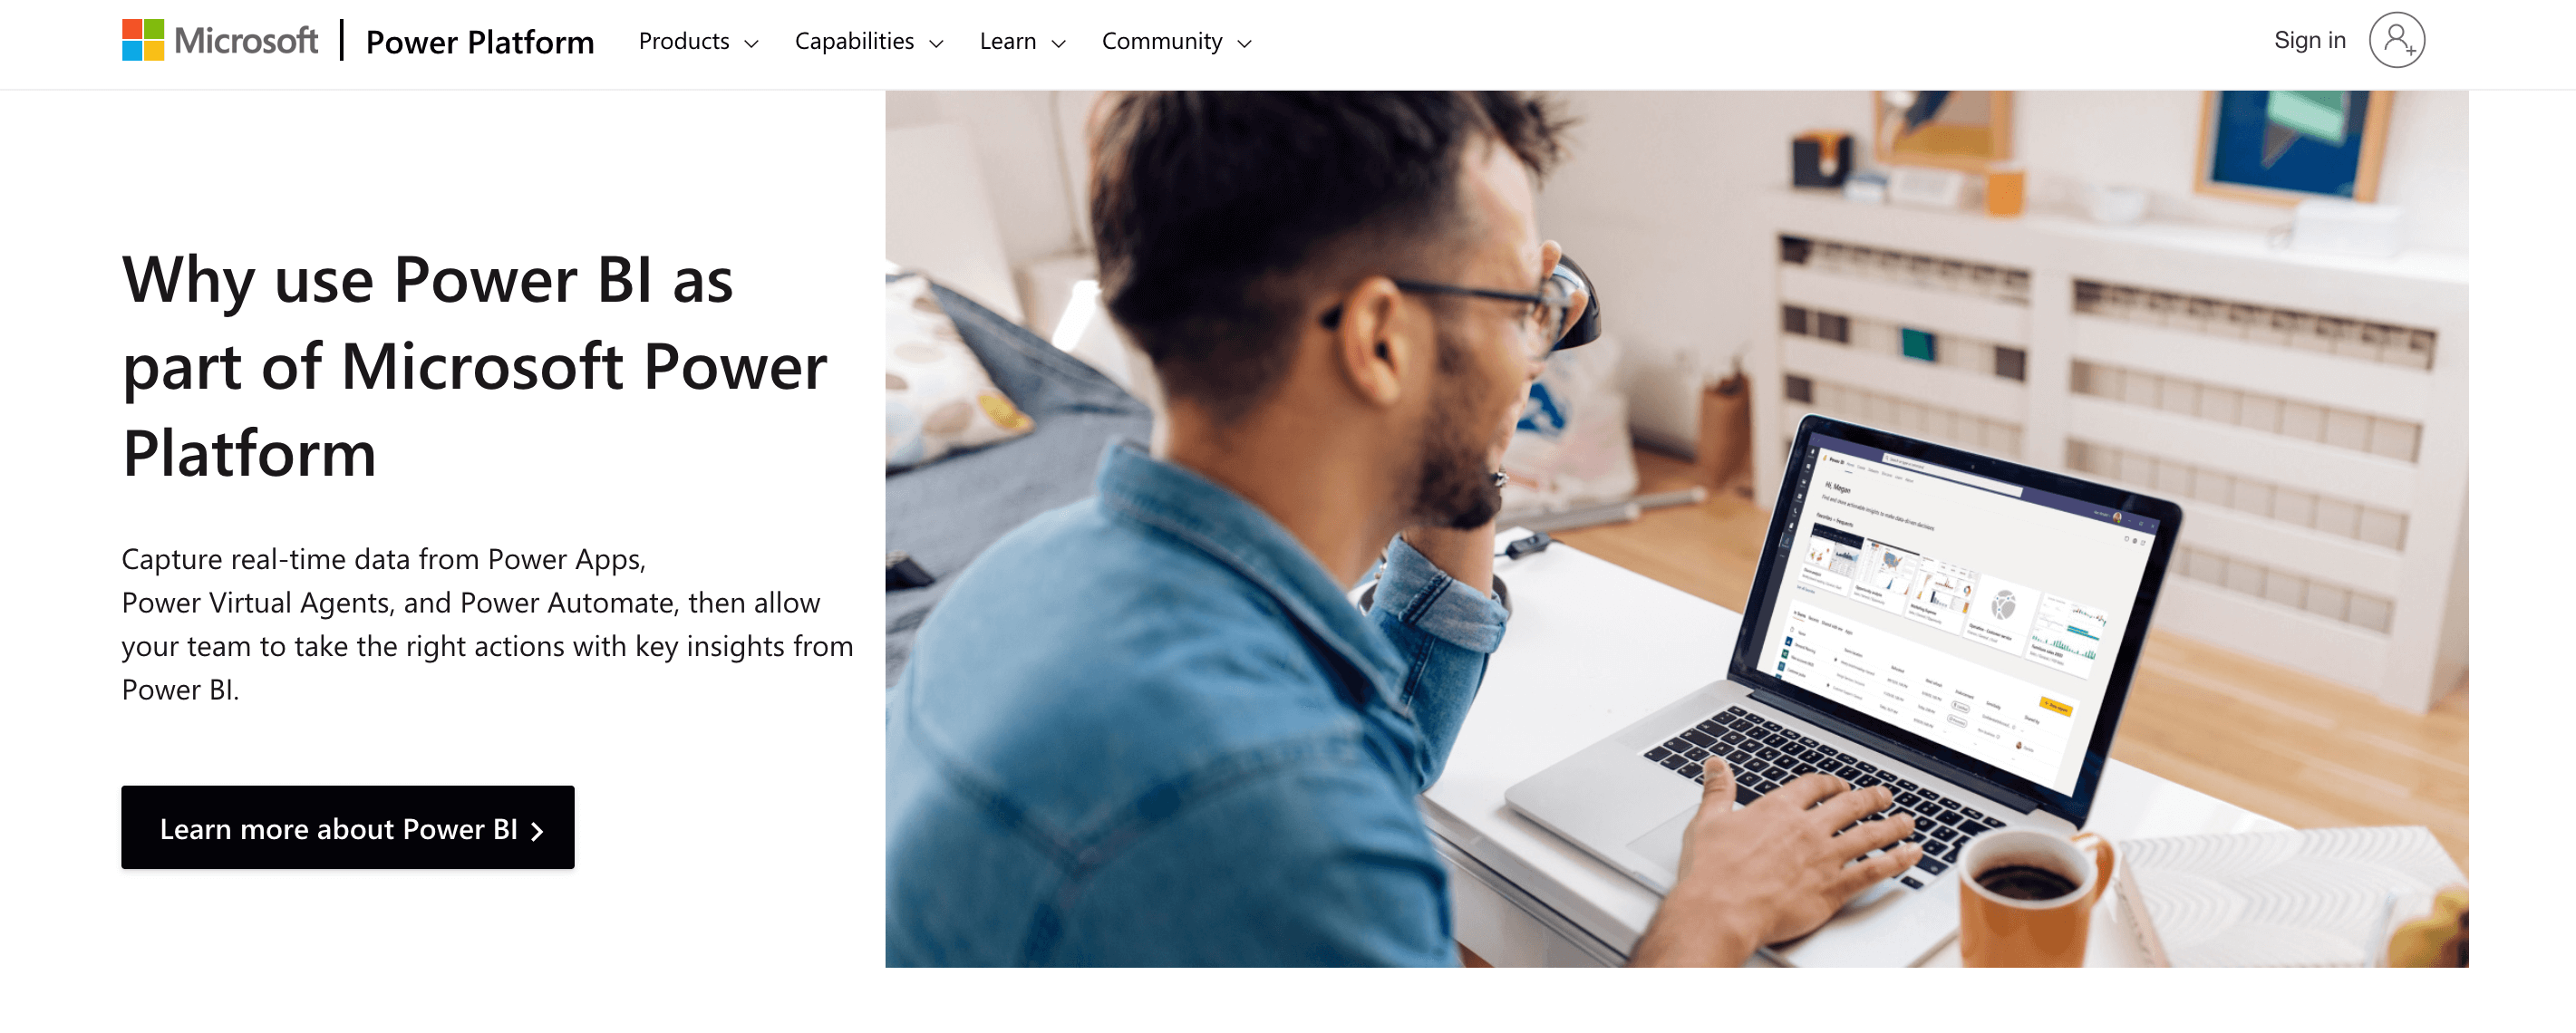
Power BI is a powerful visualization and business intelligence tool by Microsoft. The platform allows you to transform data into valuable insights in an instant. It’s like you have a means to make the data work harder.
Ideal for: It delivers better decision-making capabilities whether you are a growing business or a multinational corporation.
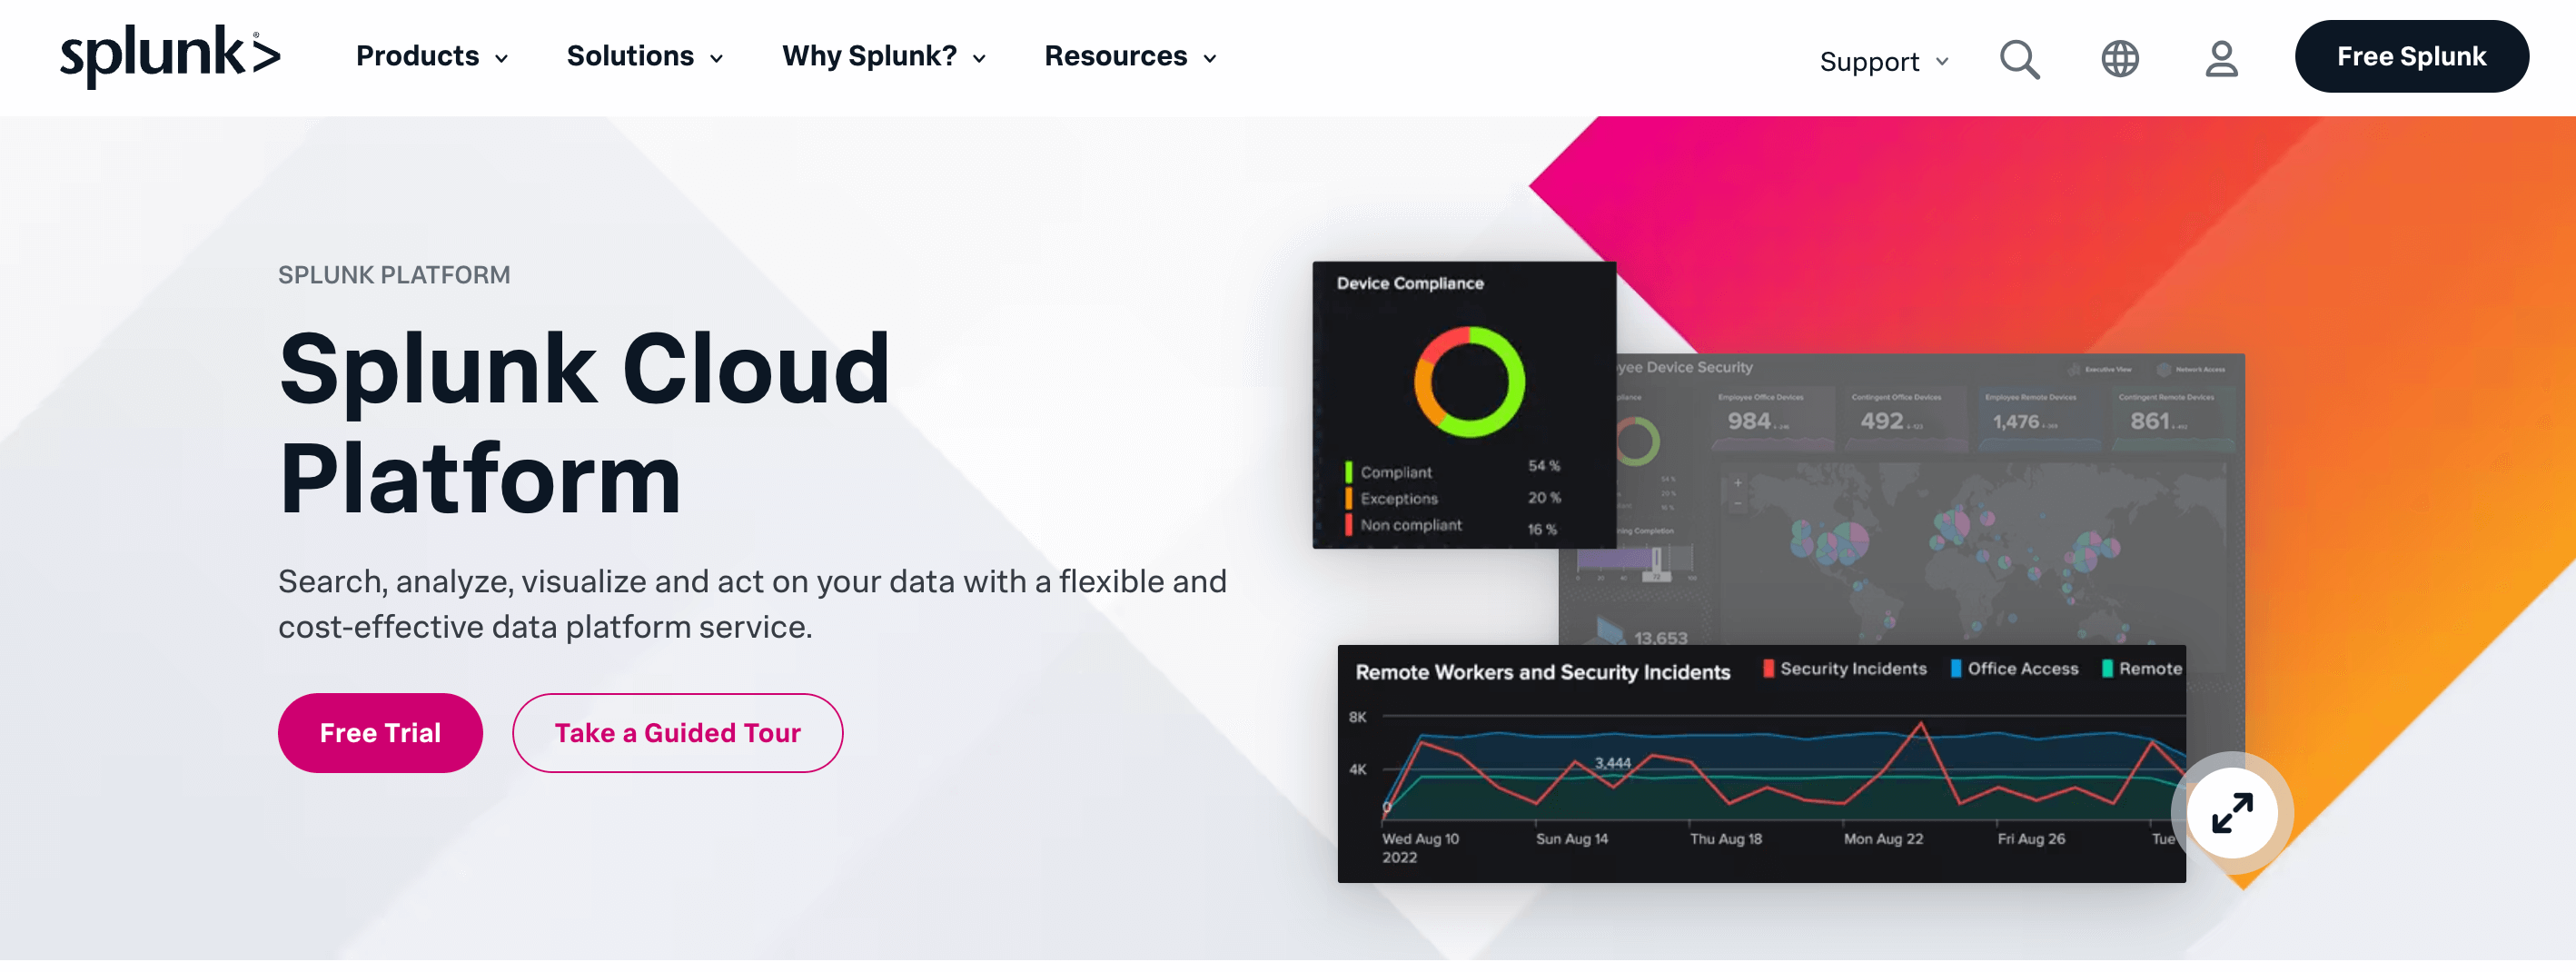
As a service, Splunk helps you effortlessly turn your data into answers. The cloud-powered platform offers many features, including data collection, indexing, and analysis capabilities. You get all this because it provides out-of-the-box dashboards and pre-configured tools.
Ideal for: Those who wish to address evolving use cases and enhance security.
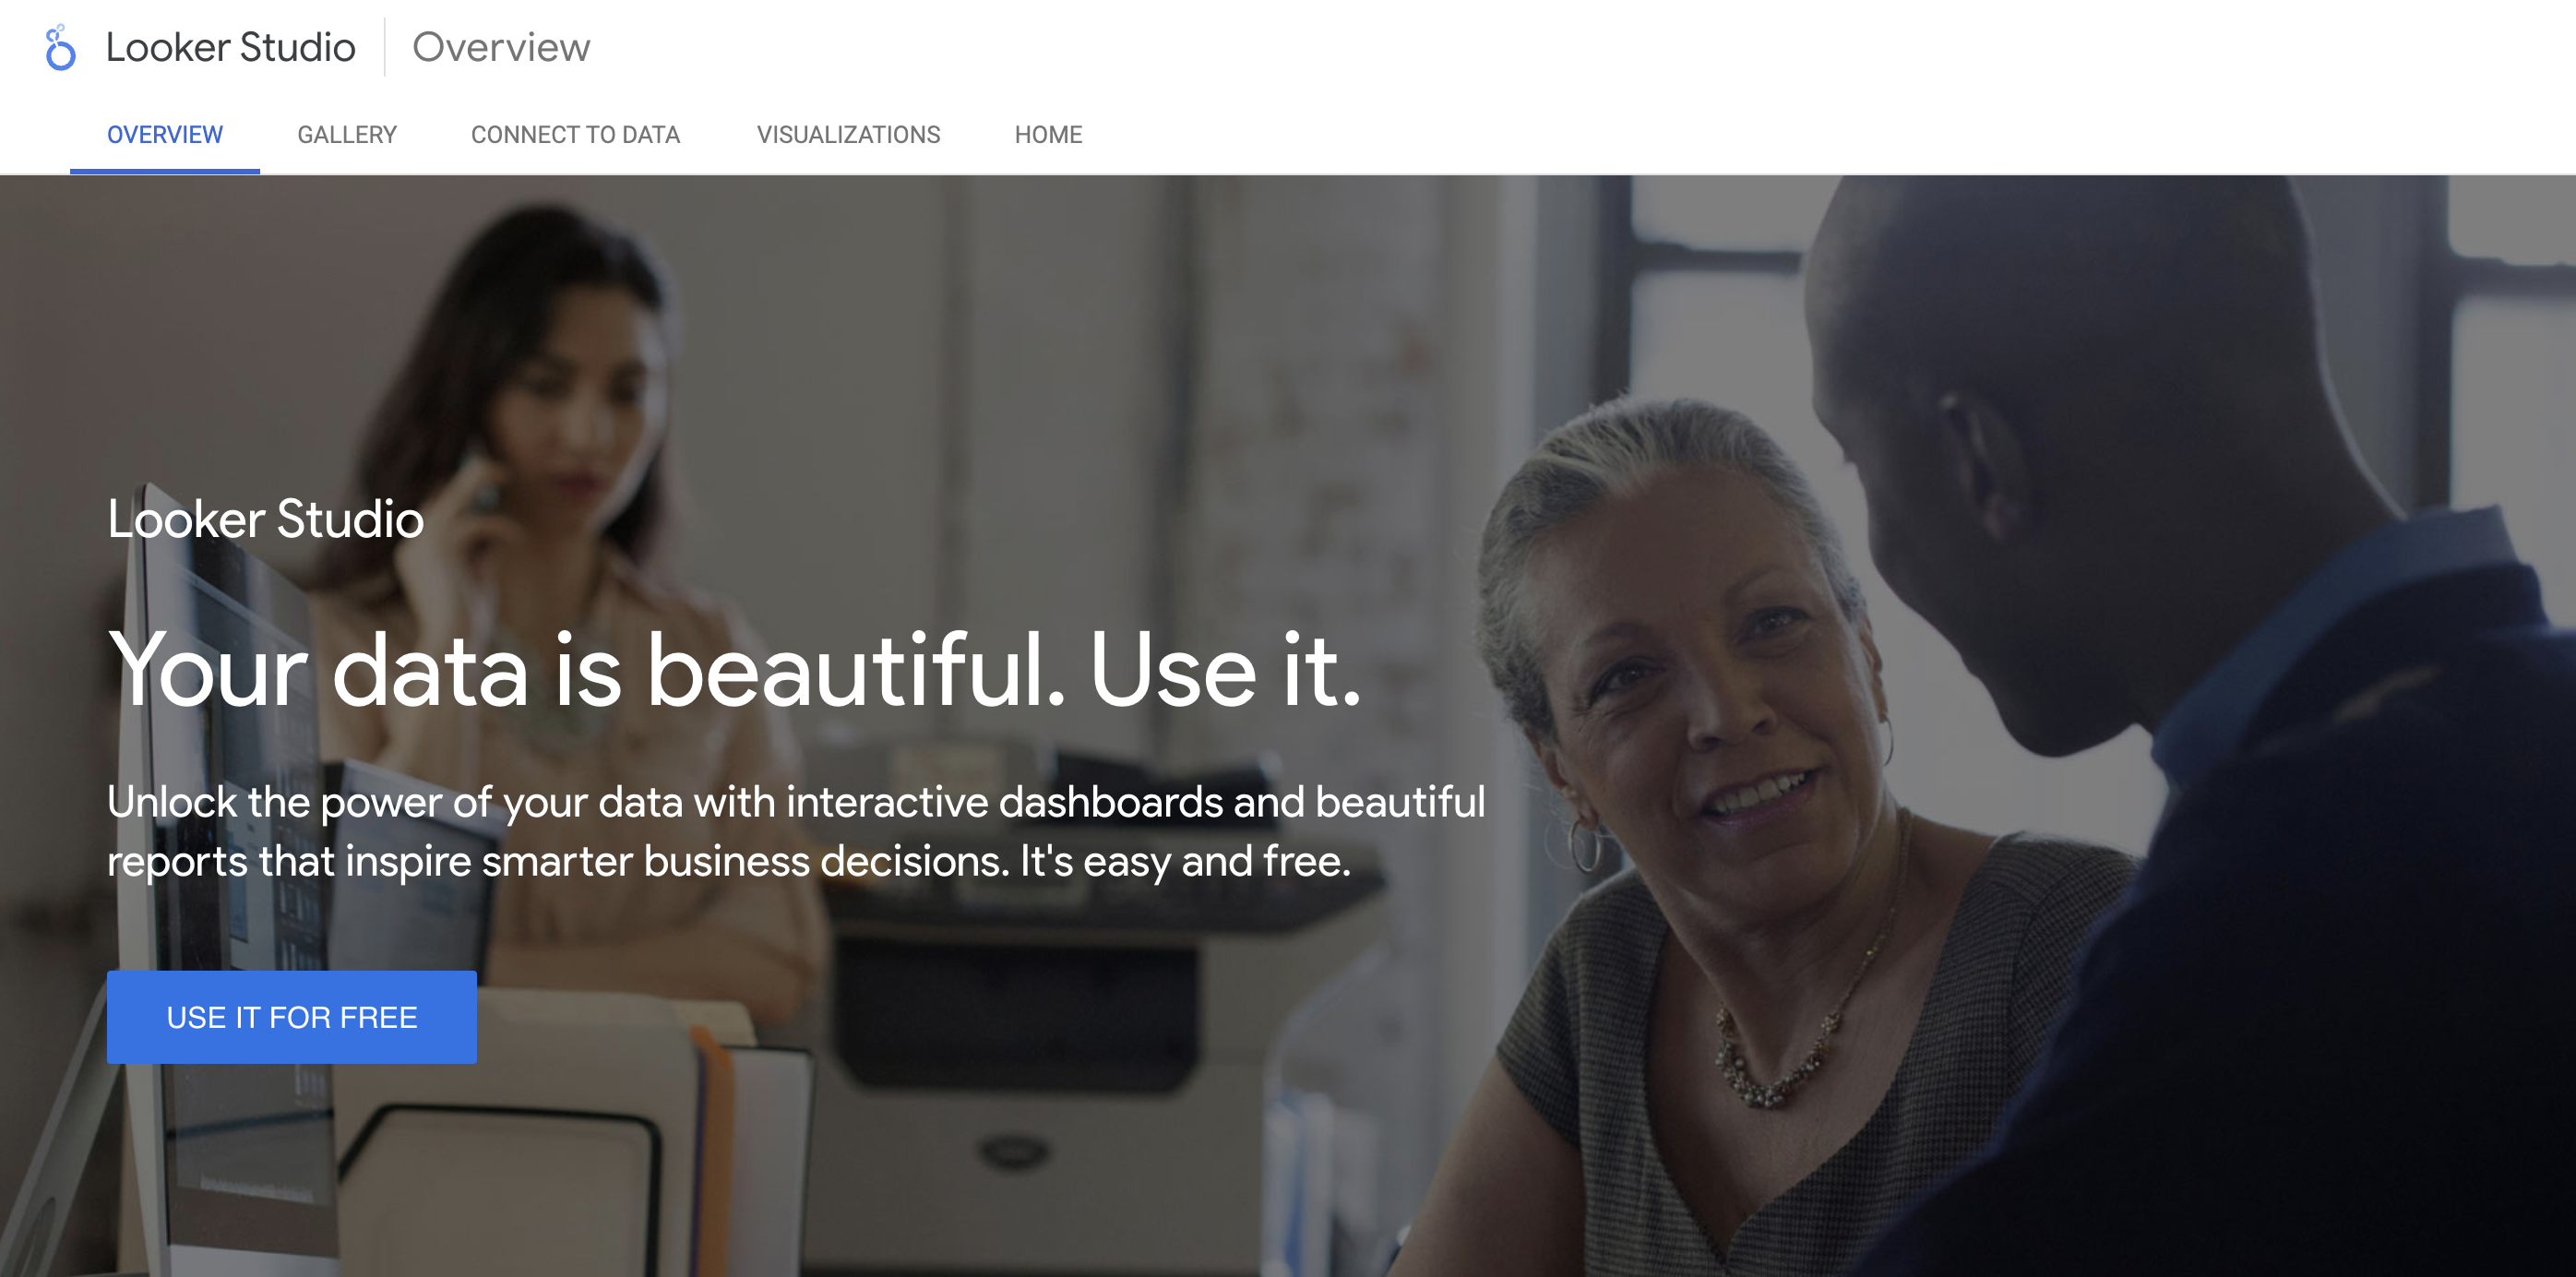
Looker is a data analytics tool offered by Google. You can easily convert data into customizable reports and dashboards. You’ll never be bored. Make sure you transform the raw data into compelling visual narratives through a creative journey!
Ideal for: Looker Studio adapts to various user needs. So, go ahead, whether you are a data analyst or an intelligence professional.
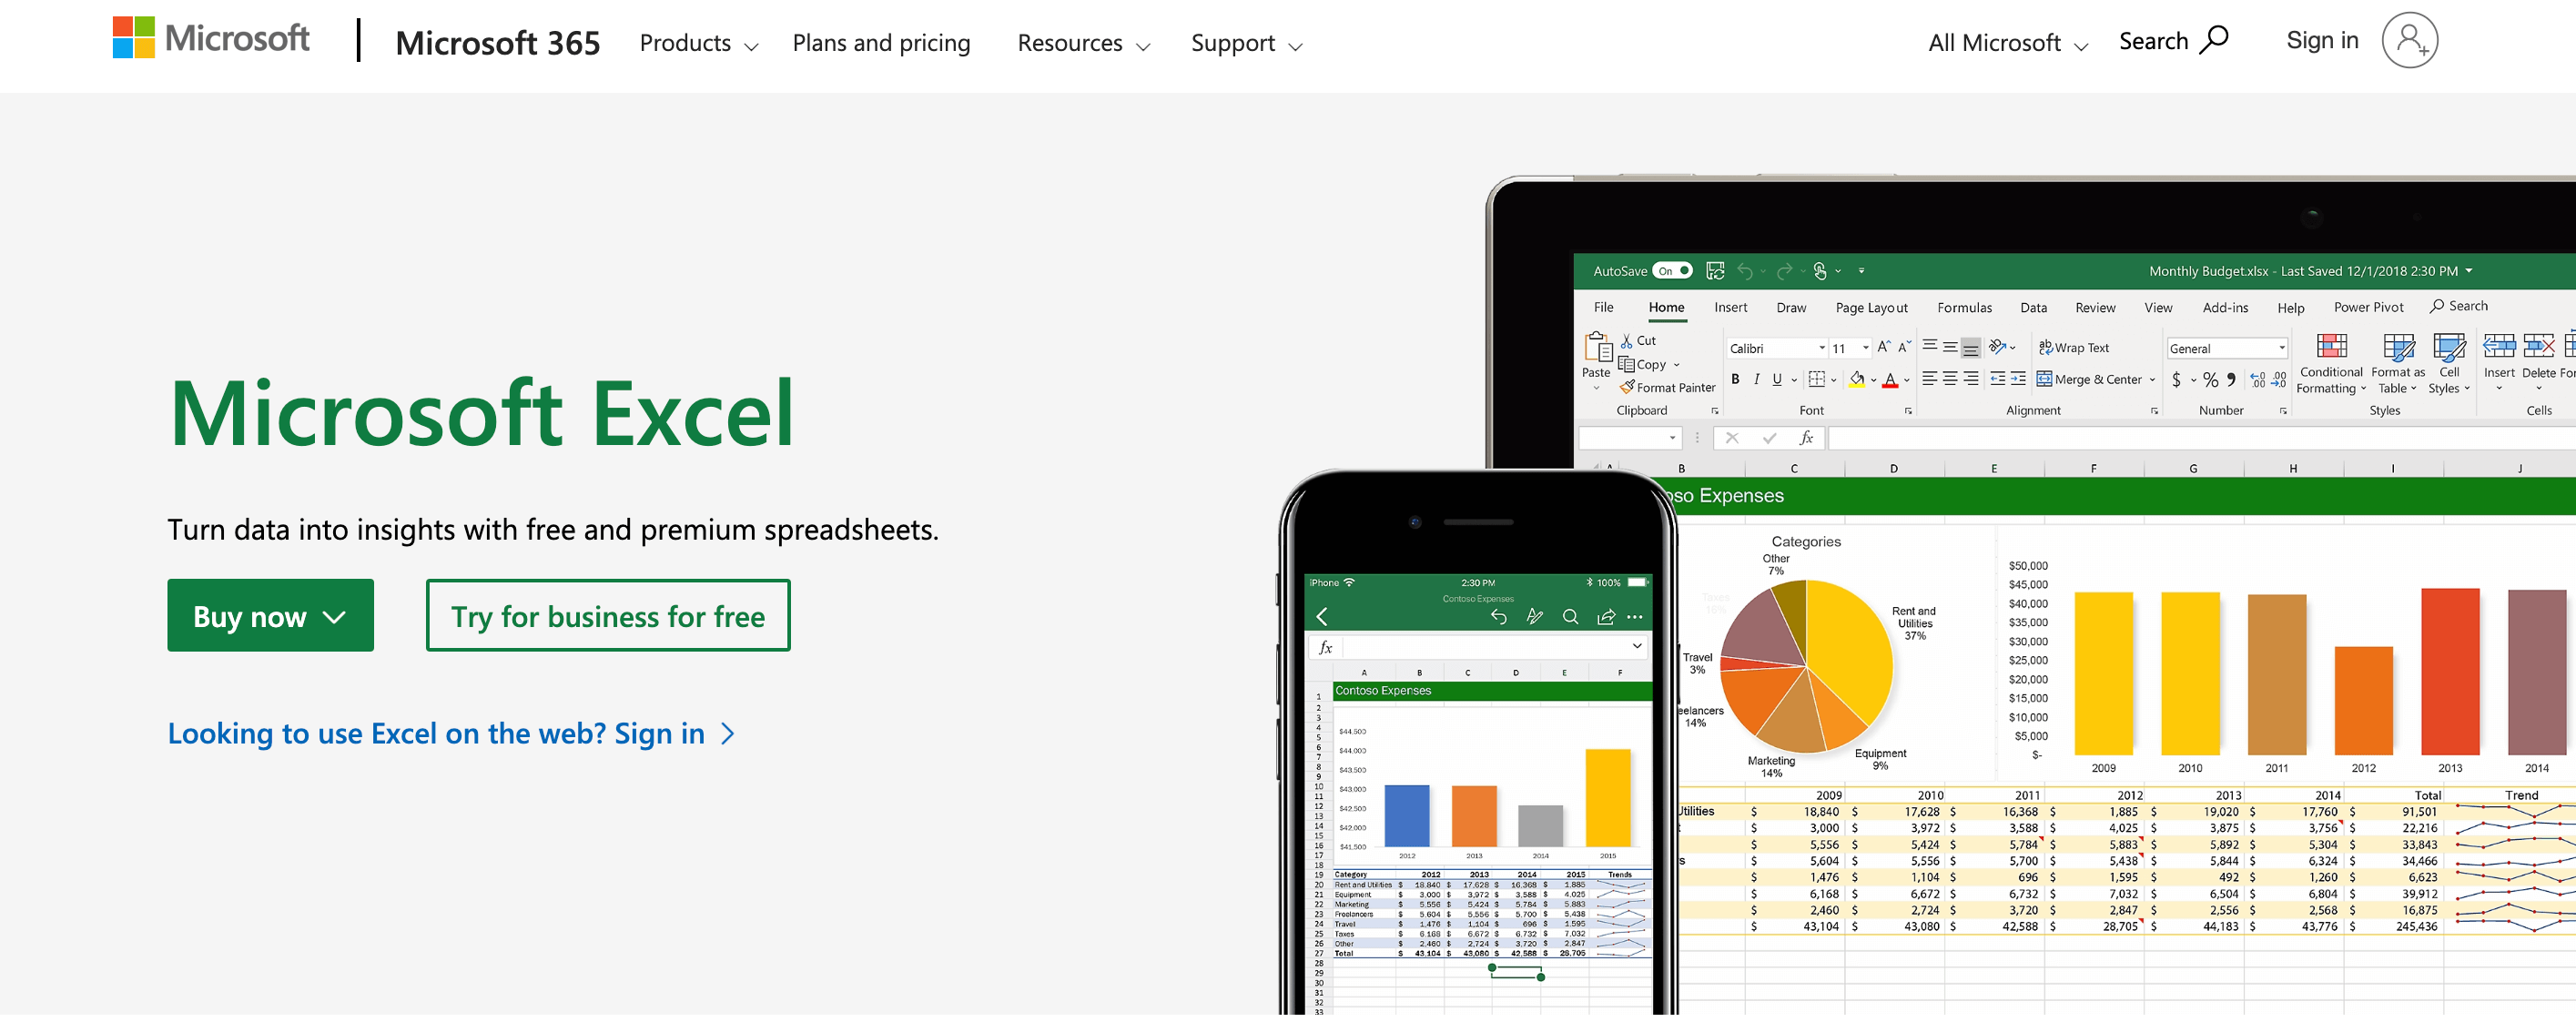
Now, Excel is a platform most of us might be familiar with. It has been our data-managing companion since god knows when!
(As a matter of fact, did you know that Microsoft released the first version of Excel for Macintosh in 1985 and the Windows version in 1987? )
The platform simplifies complex tasks. This makes it your go-to tool for organizing, calculating, and visualizing information.
Key Features:
Ideal for: This tool is for you if you deal with data regularly.
You need “data” to “analyze”.
(Wait. Hear me out. I have a valid reason to bring this up!)
Without data analytics tools, all that information will be just numbers and words. Even so, if you decide to bring about meaning on your own, it will take years (Well, maybe at least a few days, right?)
Similarly, these tools are completely useless if you don’t have precise, to-the-point data in your hands.
Now, how do you go about that?
Manually fetching data is time-consuming and, if I may, outright impractical. You need an advanced tool to streamline the process. Admit it.
Why again? Because it’s tricky.
But don’t you worry! There are several data collection tools available in the market. I’ll talk about one that might have caught your eye.
It’s not just any survey tool, I tell you. SurveySparrow simplifies your data collection journey.
With SurveySparrow, you get the following:
Oh, since we’re talking about integrations, there’s one that’ll pique your interest!
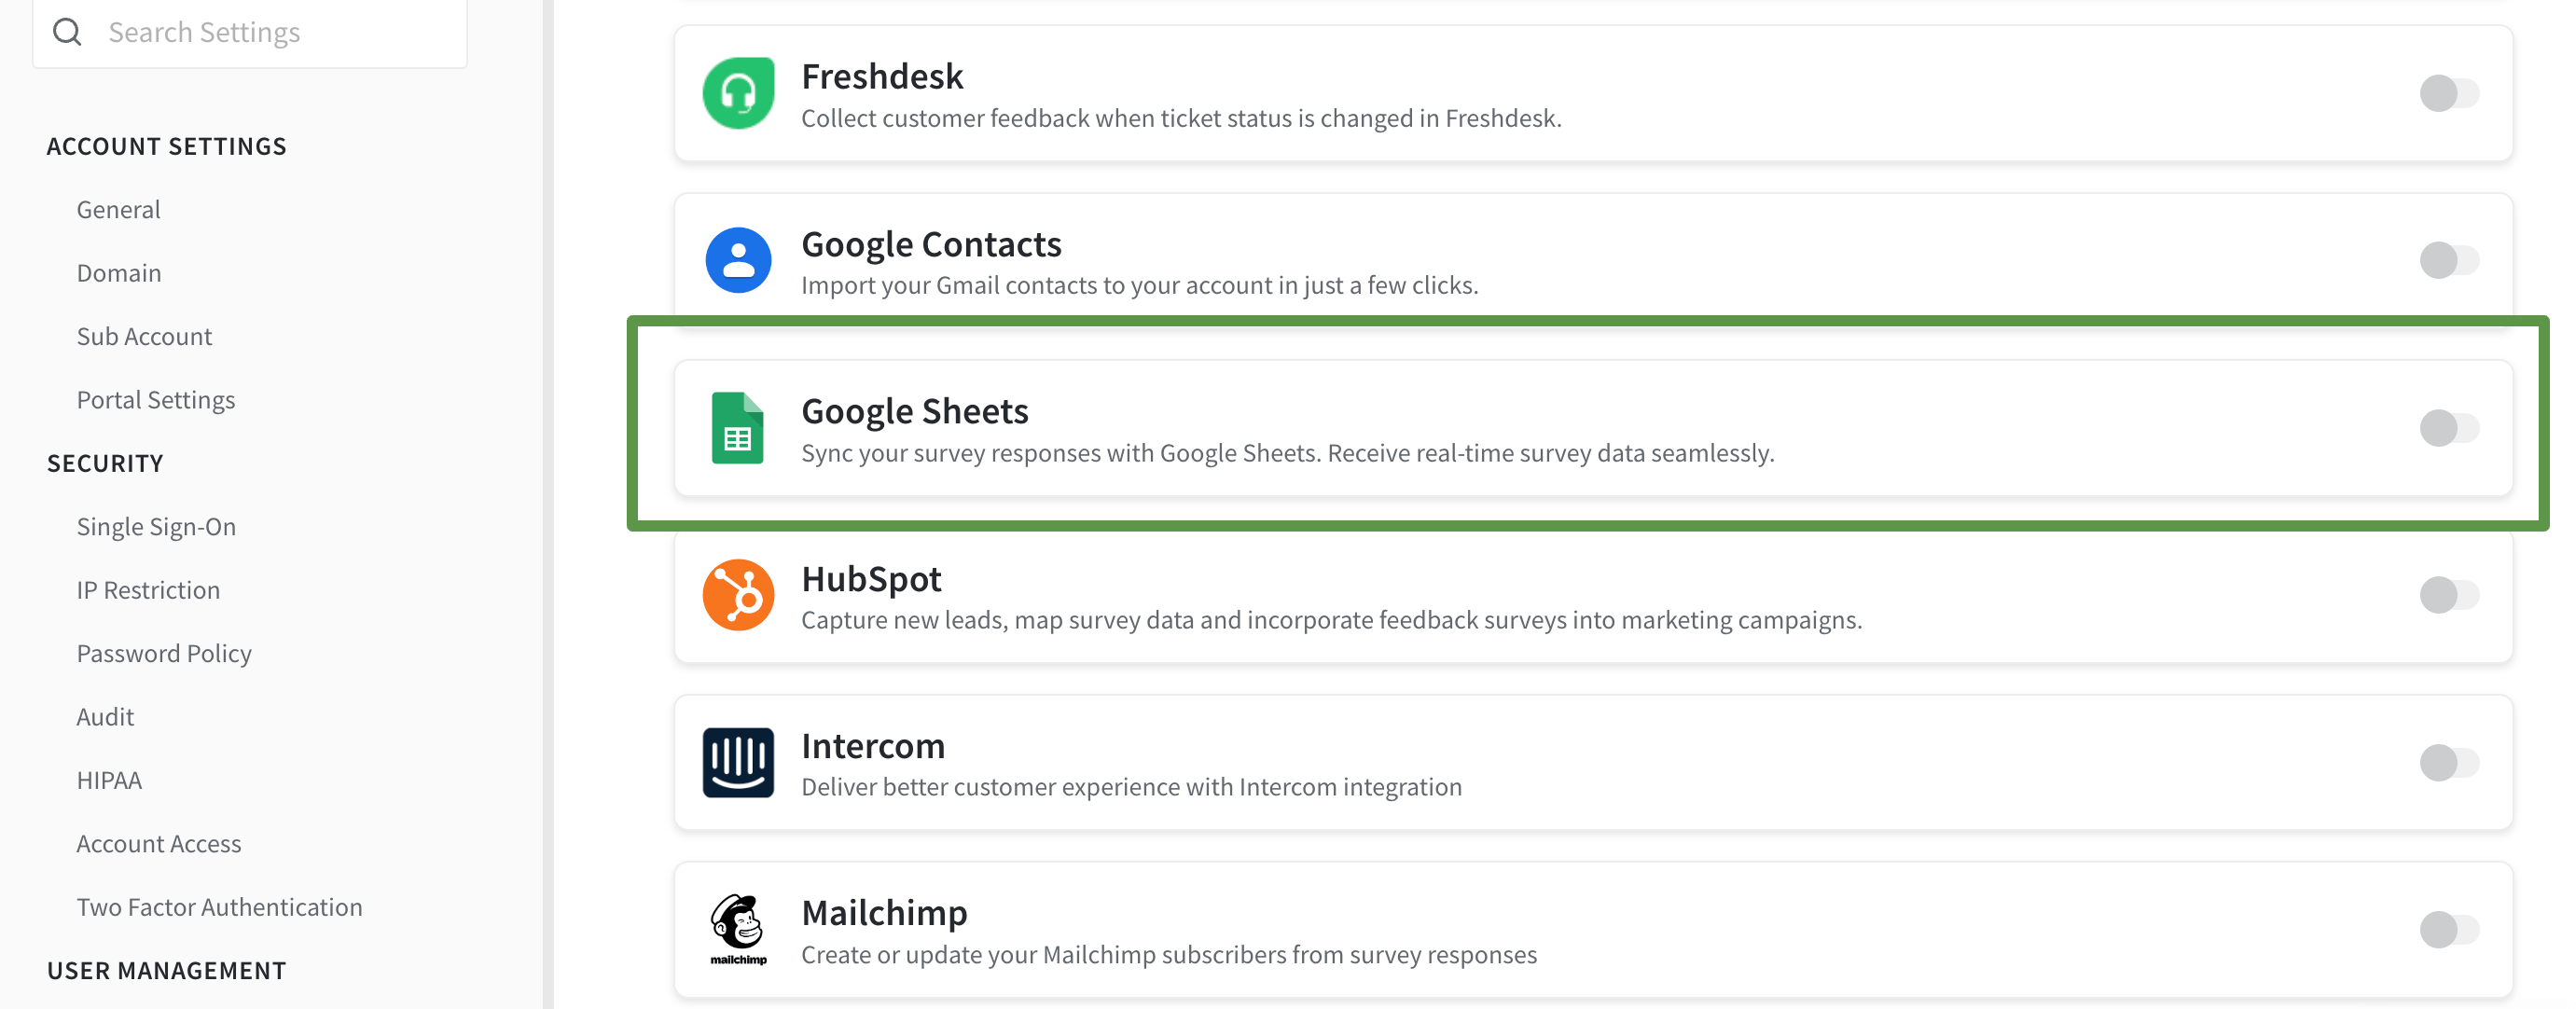
SurveySparrow’s integration with Google opens up a world of possibilities for data enthusiasts. It adds another layer of flexibility. Here’s why the feature is a game-changer:
1. Export to Google Sheets:
Effortlessly export data to Google Sheets. It’s like creating a central hub for your information. This makes sure that your data is accessible and ready for analysis.
2. Compatibility with Analytics Tools:
Use the exported data in any analytics tool of your choice. Whether you prefer Looker Studio, Tableau, or others, the Google integration feature makes your data versatile and adaptable.
3. Real-Time Collaboration:
Use it to work on your data collectively. With real-time updates, collaboration becomes seamless!
PS: In case you need help with the setup, check this out: Integrating SurveySparrow with Google Sheets

A personalized walkthrough by our experts. No strings attached!
There you have it. This was our top pick on the data analytics tools in the market (and a bonus at the end!). Now, since you know each tool’s strengths, you must choose the one that best fits your requirements. The choice is not just a matter of preference, though. It is a strategic decision that can make or break your growth!
So, happy exploring!

Thousands of brands trust SurveySparrow to turn feedback into growth. Try it free today!

Best Of
7 MINUTES
12 July 2022

Best Of
15 MINUTES
8 March 2021

Best Of
13 MINUTES
18 November 2019

Best Of
14 MINUTES
29 December 2020